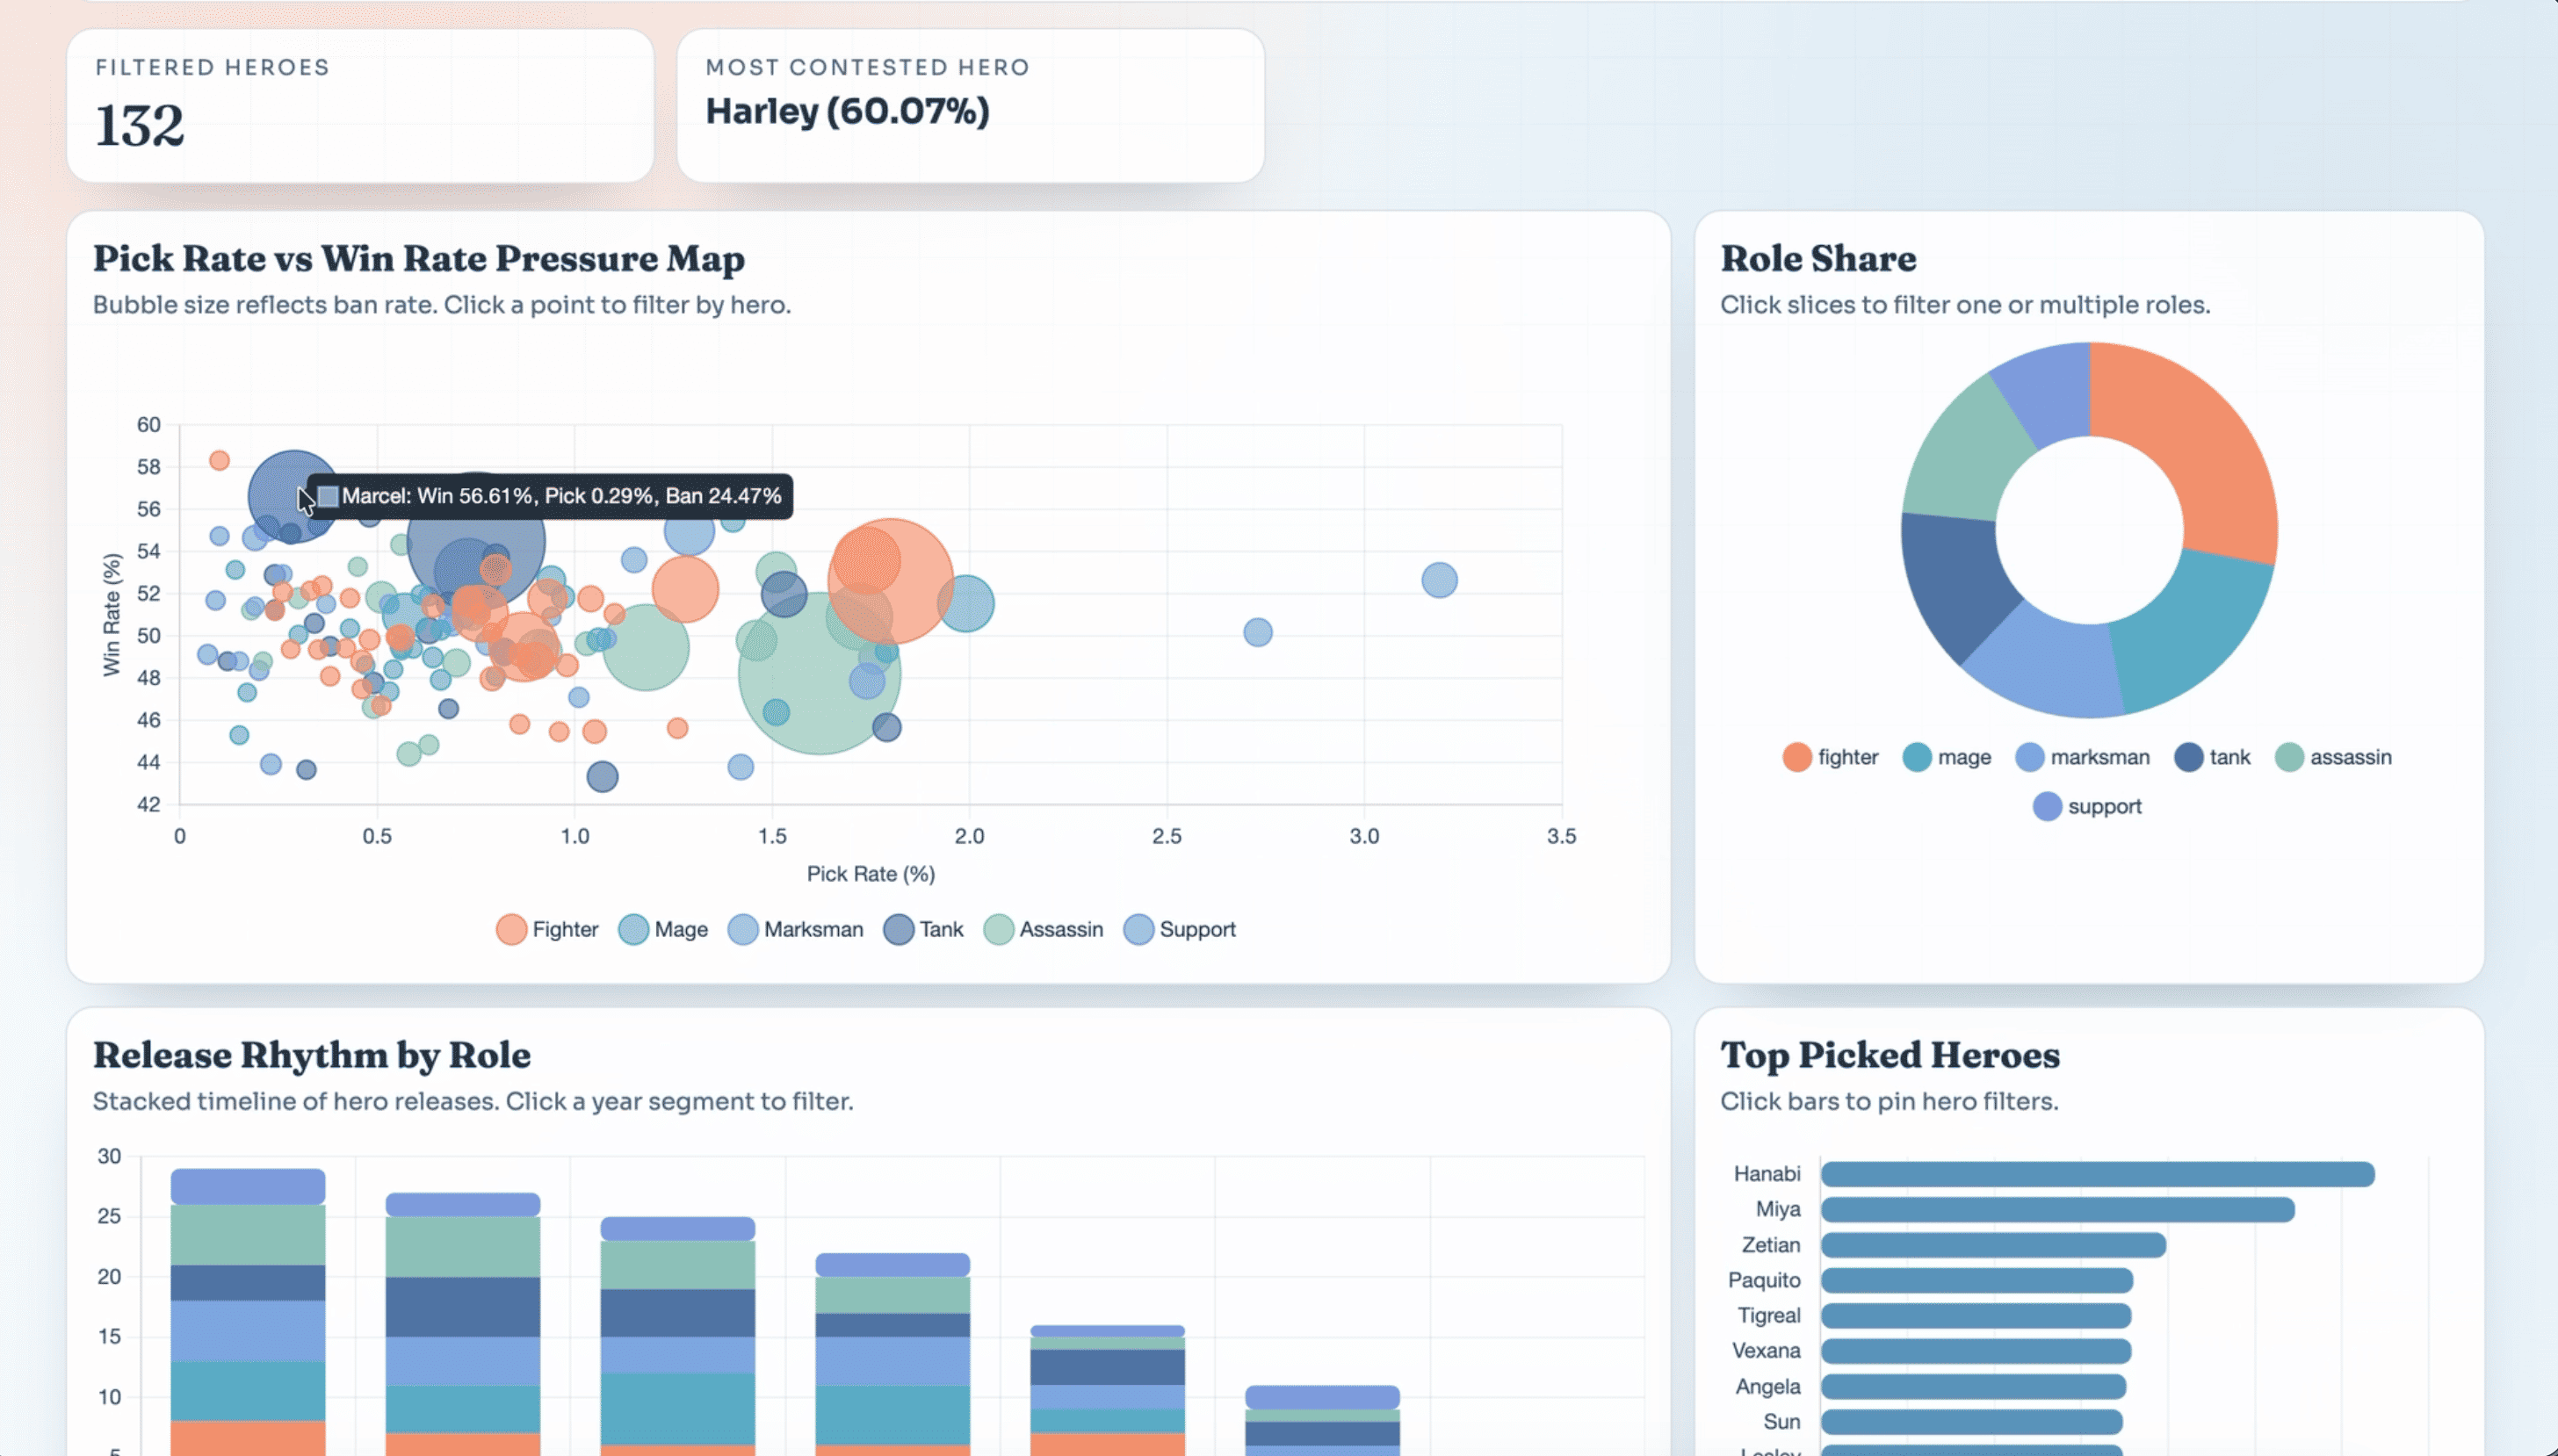
A simple dashboard to explore Mobile Legends heroes, stats, and trends.
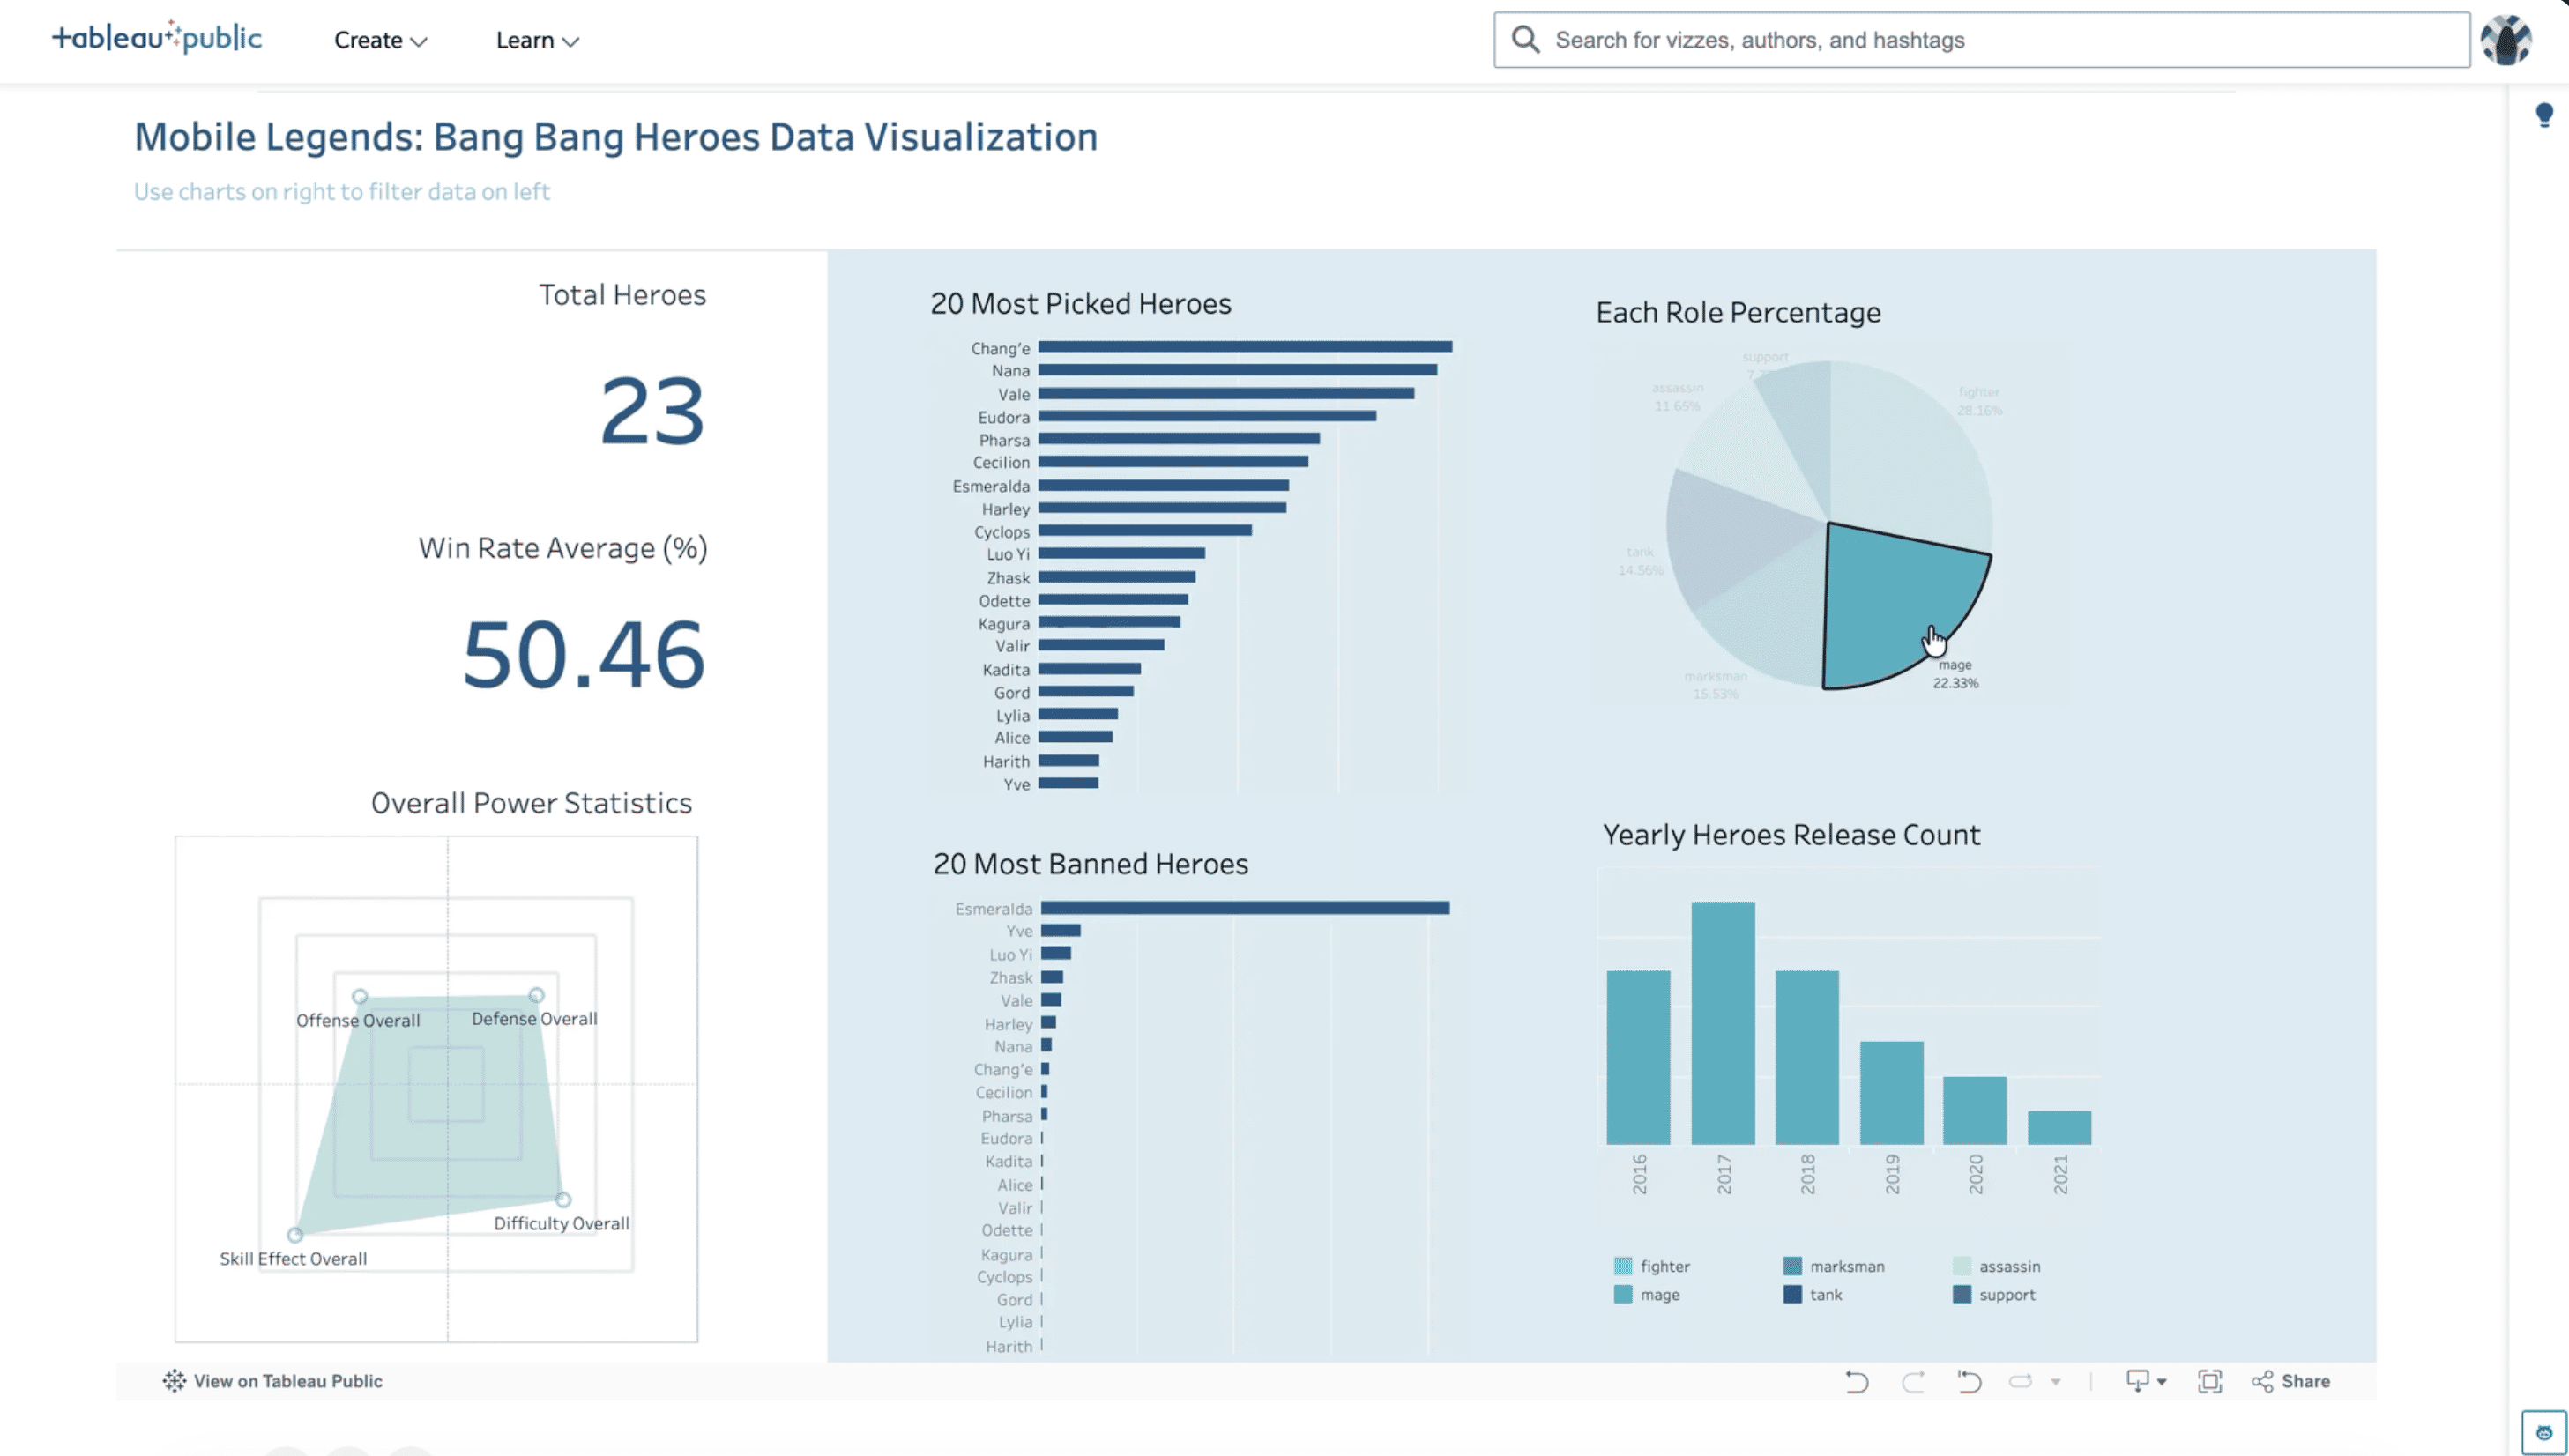
This isn’t my first MLBB dashboard. Back in 2021, I made one in Tableau (here it is, for nostalgia).
Fast forward a few years: new heroes, new meta, and me wondering “who’s actually strong right now?” So I rebuilt it from scratch, this time with my own data pipeline and a web dashboard 🎮.
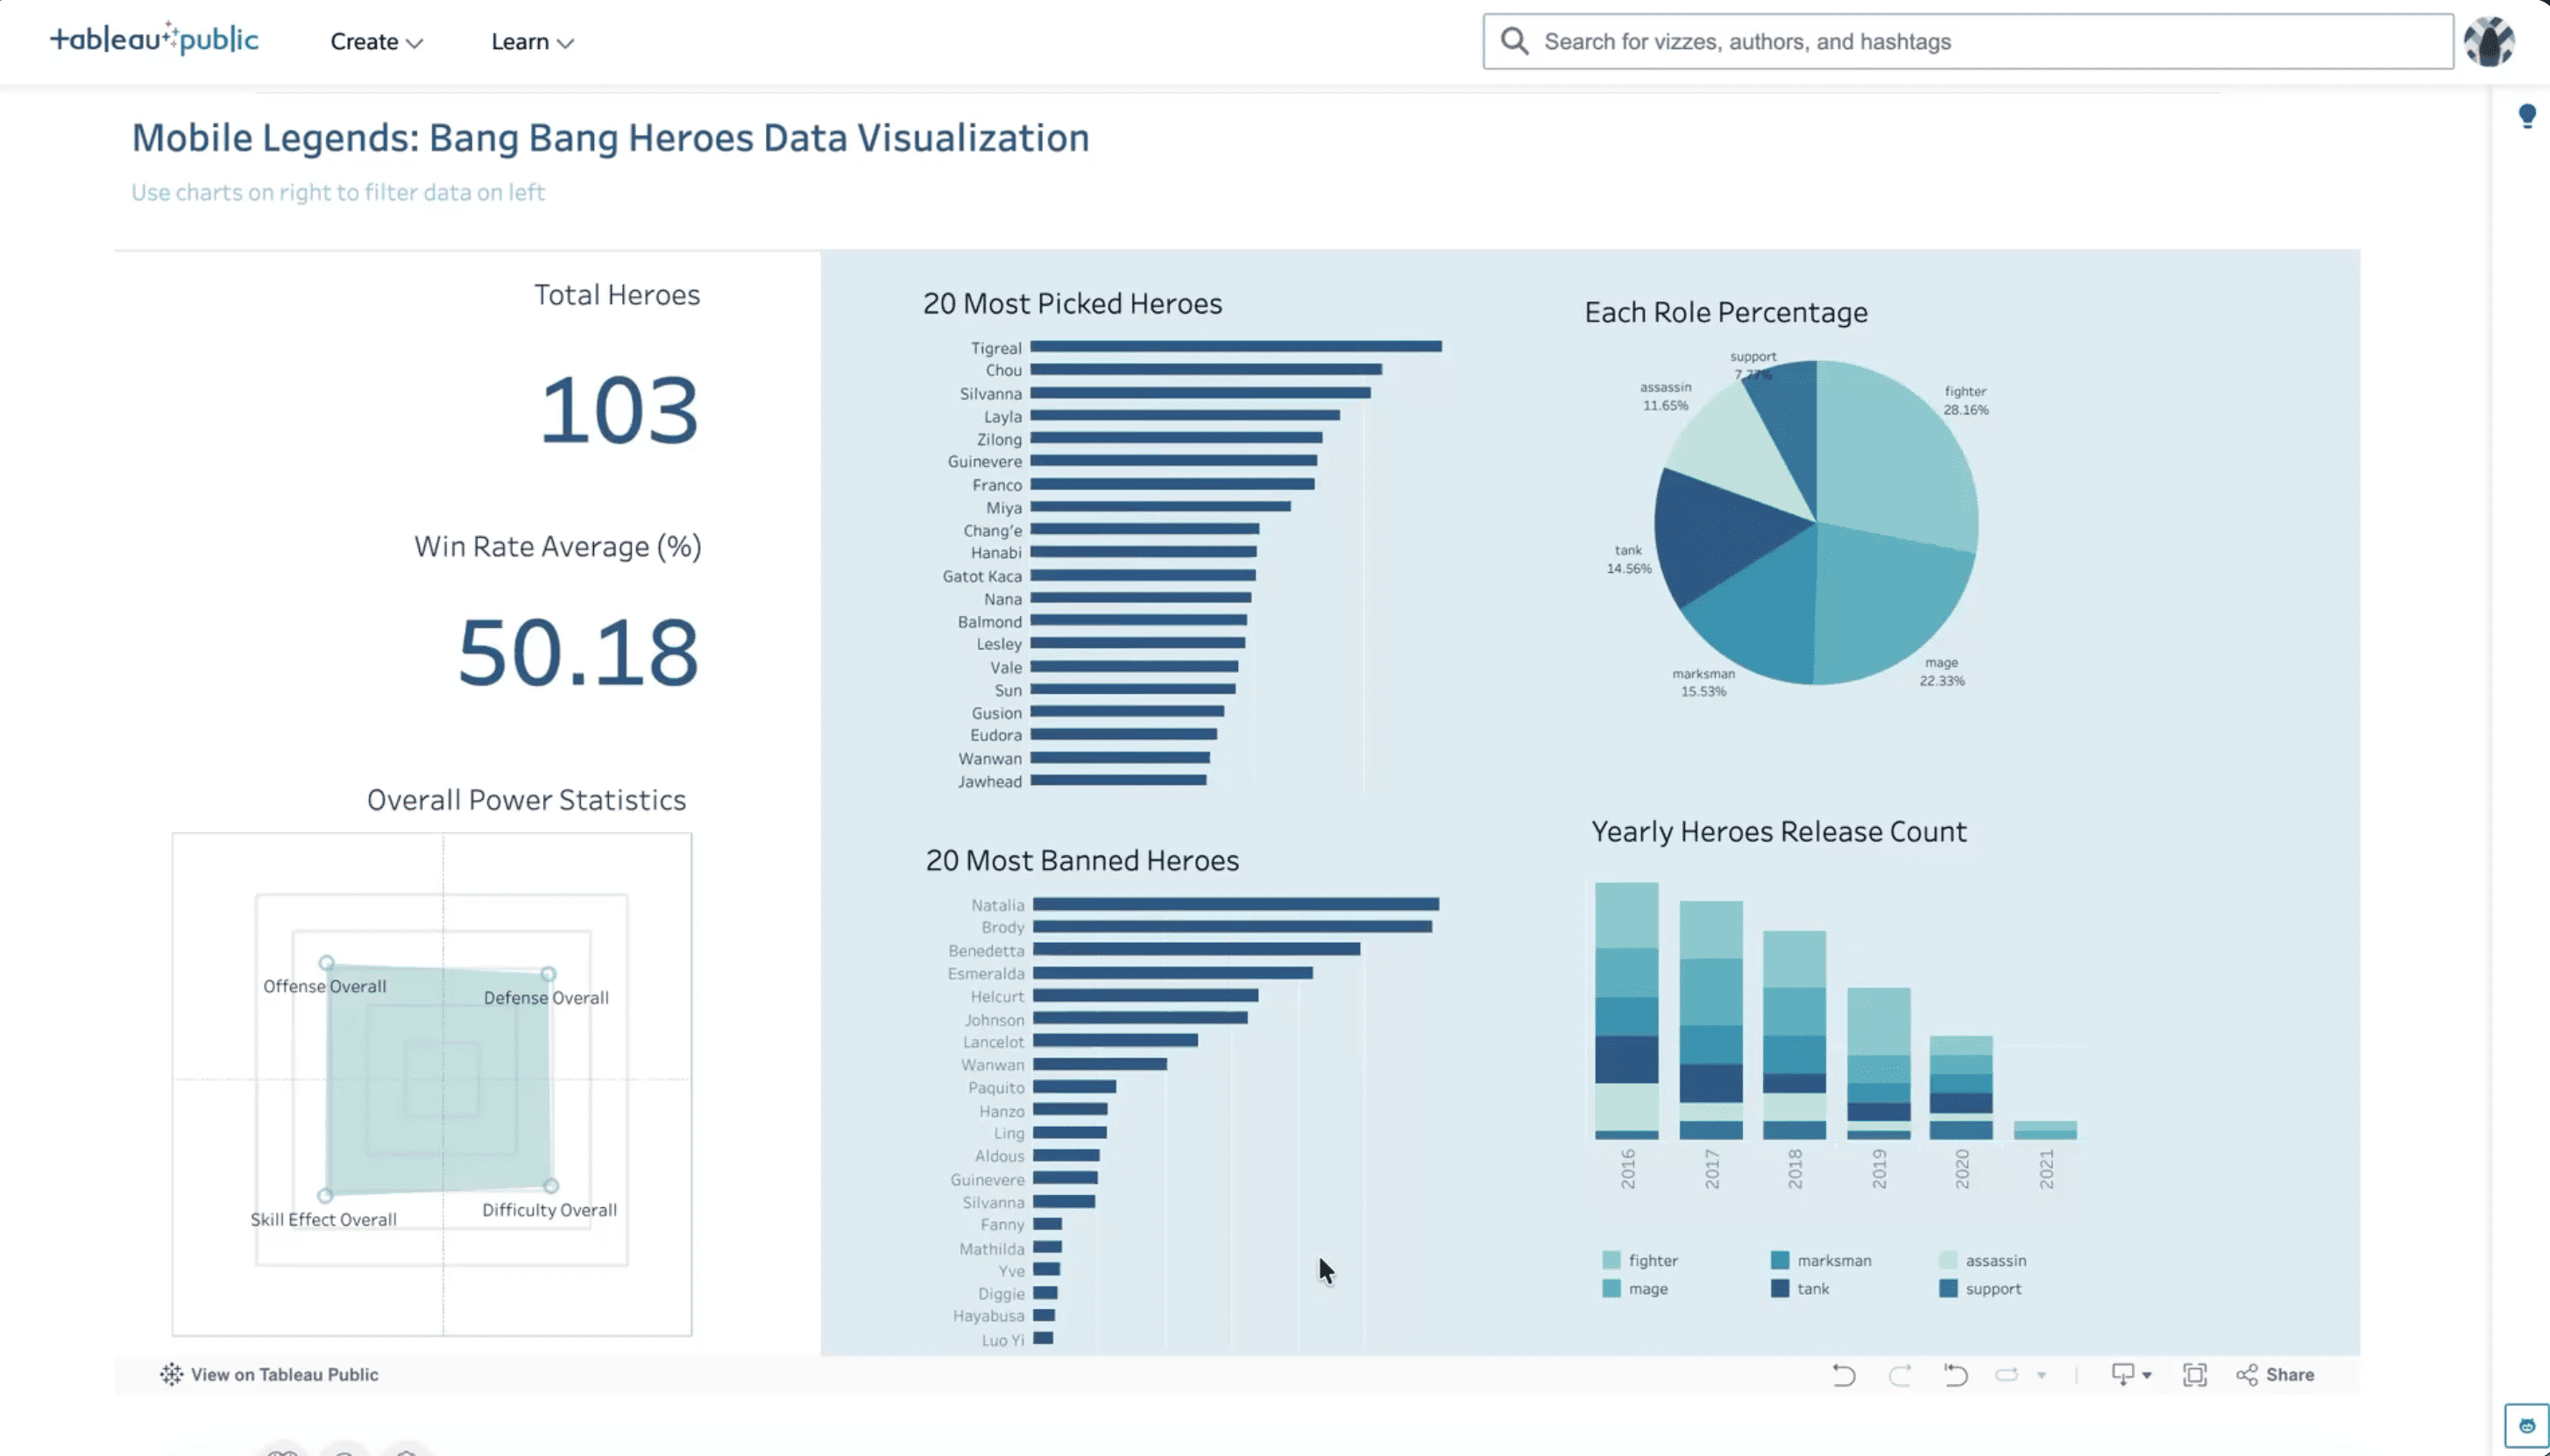
🔎 Overview
- Goal: Make hero stats easy to explore without building a full backend.
- Use cases: Compare heroes, spot popular picks, check ban rates, and explore roles.
- Tech stack: Python, CSV, Vite, TypeScript, Papa Parse, and Chart.js.
- What you get: Interactive charts, role/year/hero filters, KPIs, and rankings.
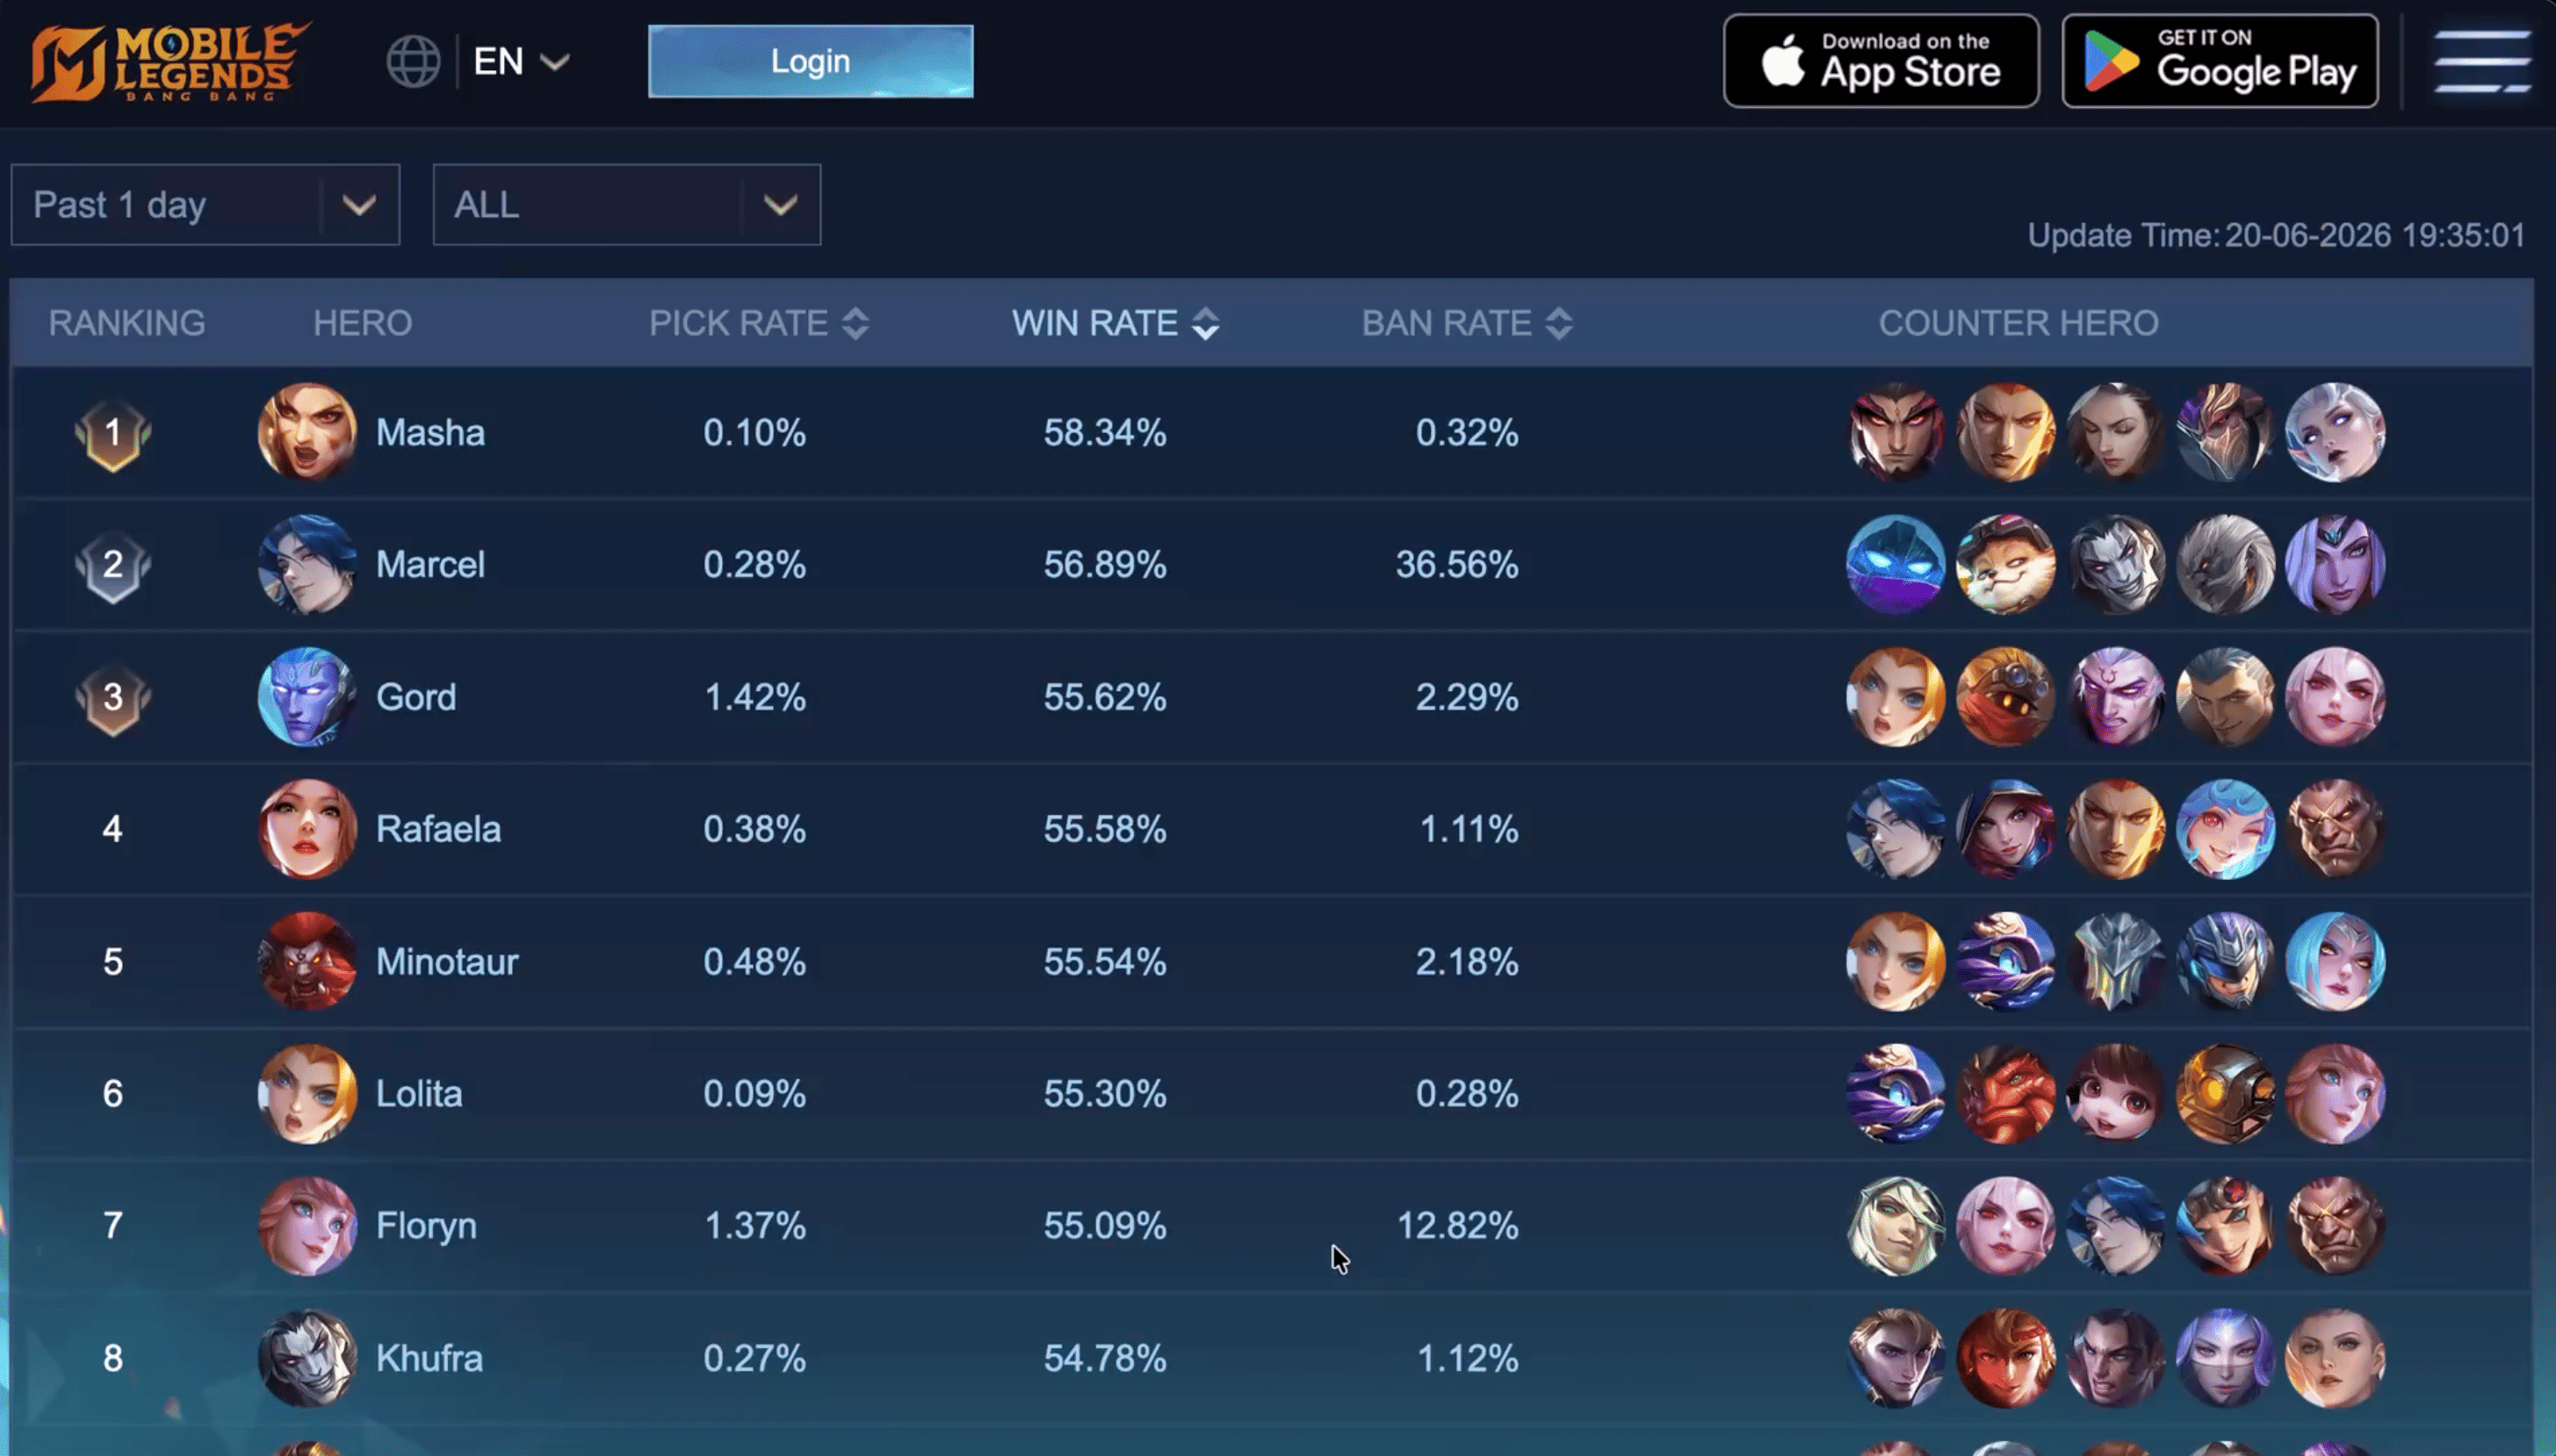
- Data: A 132-hero CSV snapshot, not live game data.
🗺️ How Everything Connects
The nerdy view:
flowchart LR
    API["Hero List + Rank Data"] --> PY["Python Scraper"]
    OLD["2021 CSV Baseline"] --> PY
    PY --> CSV["Latest Hero CSV"]
    CSV --> WEB["Static Website"]
    APP["Vite + TypeScript"] --> WEB
    WEB --> USER["Browser"]
    USER --> PARSE["Parse"]
    PARSE --> CHART["Chart.js: Charts + Filters"]
The big-picture view:
flowchart LR
    A["Game Stats"] --> B["Python Collects Data"]
    B --> C["CSV File"]
    C --> D["Website"]
    D --> E["You Explore Charts"]
Easy way to remember: Python prepares the data. The website shows it. Your browser handles the filters.
🔨 From Game Stats to Charts
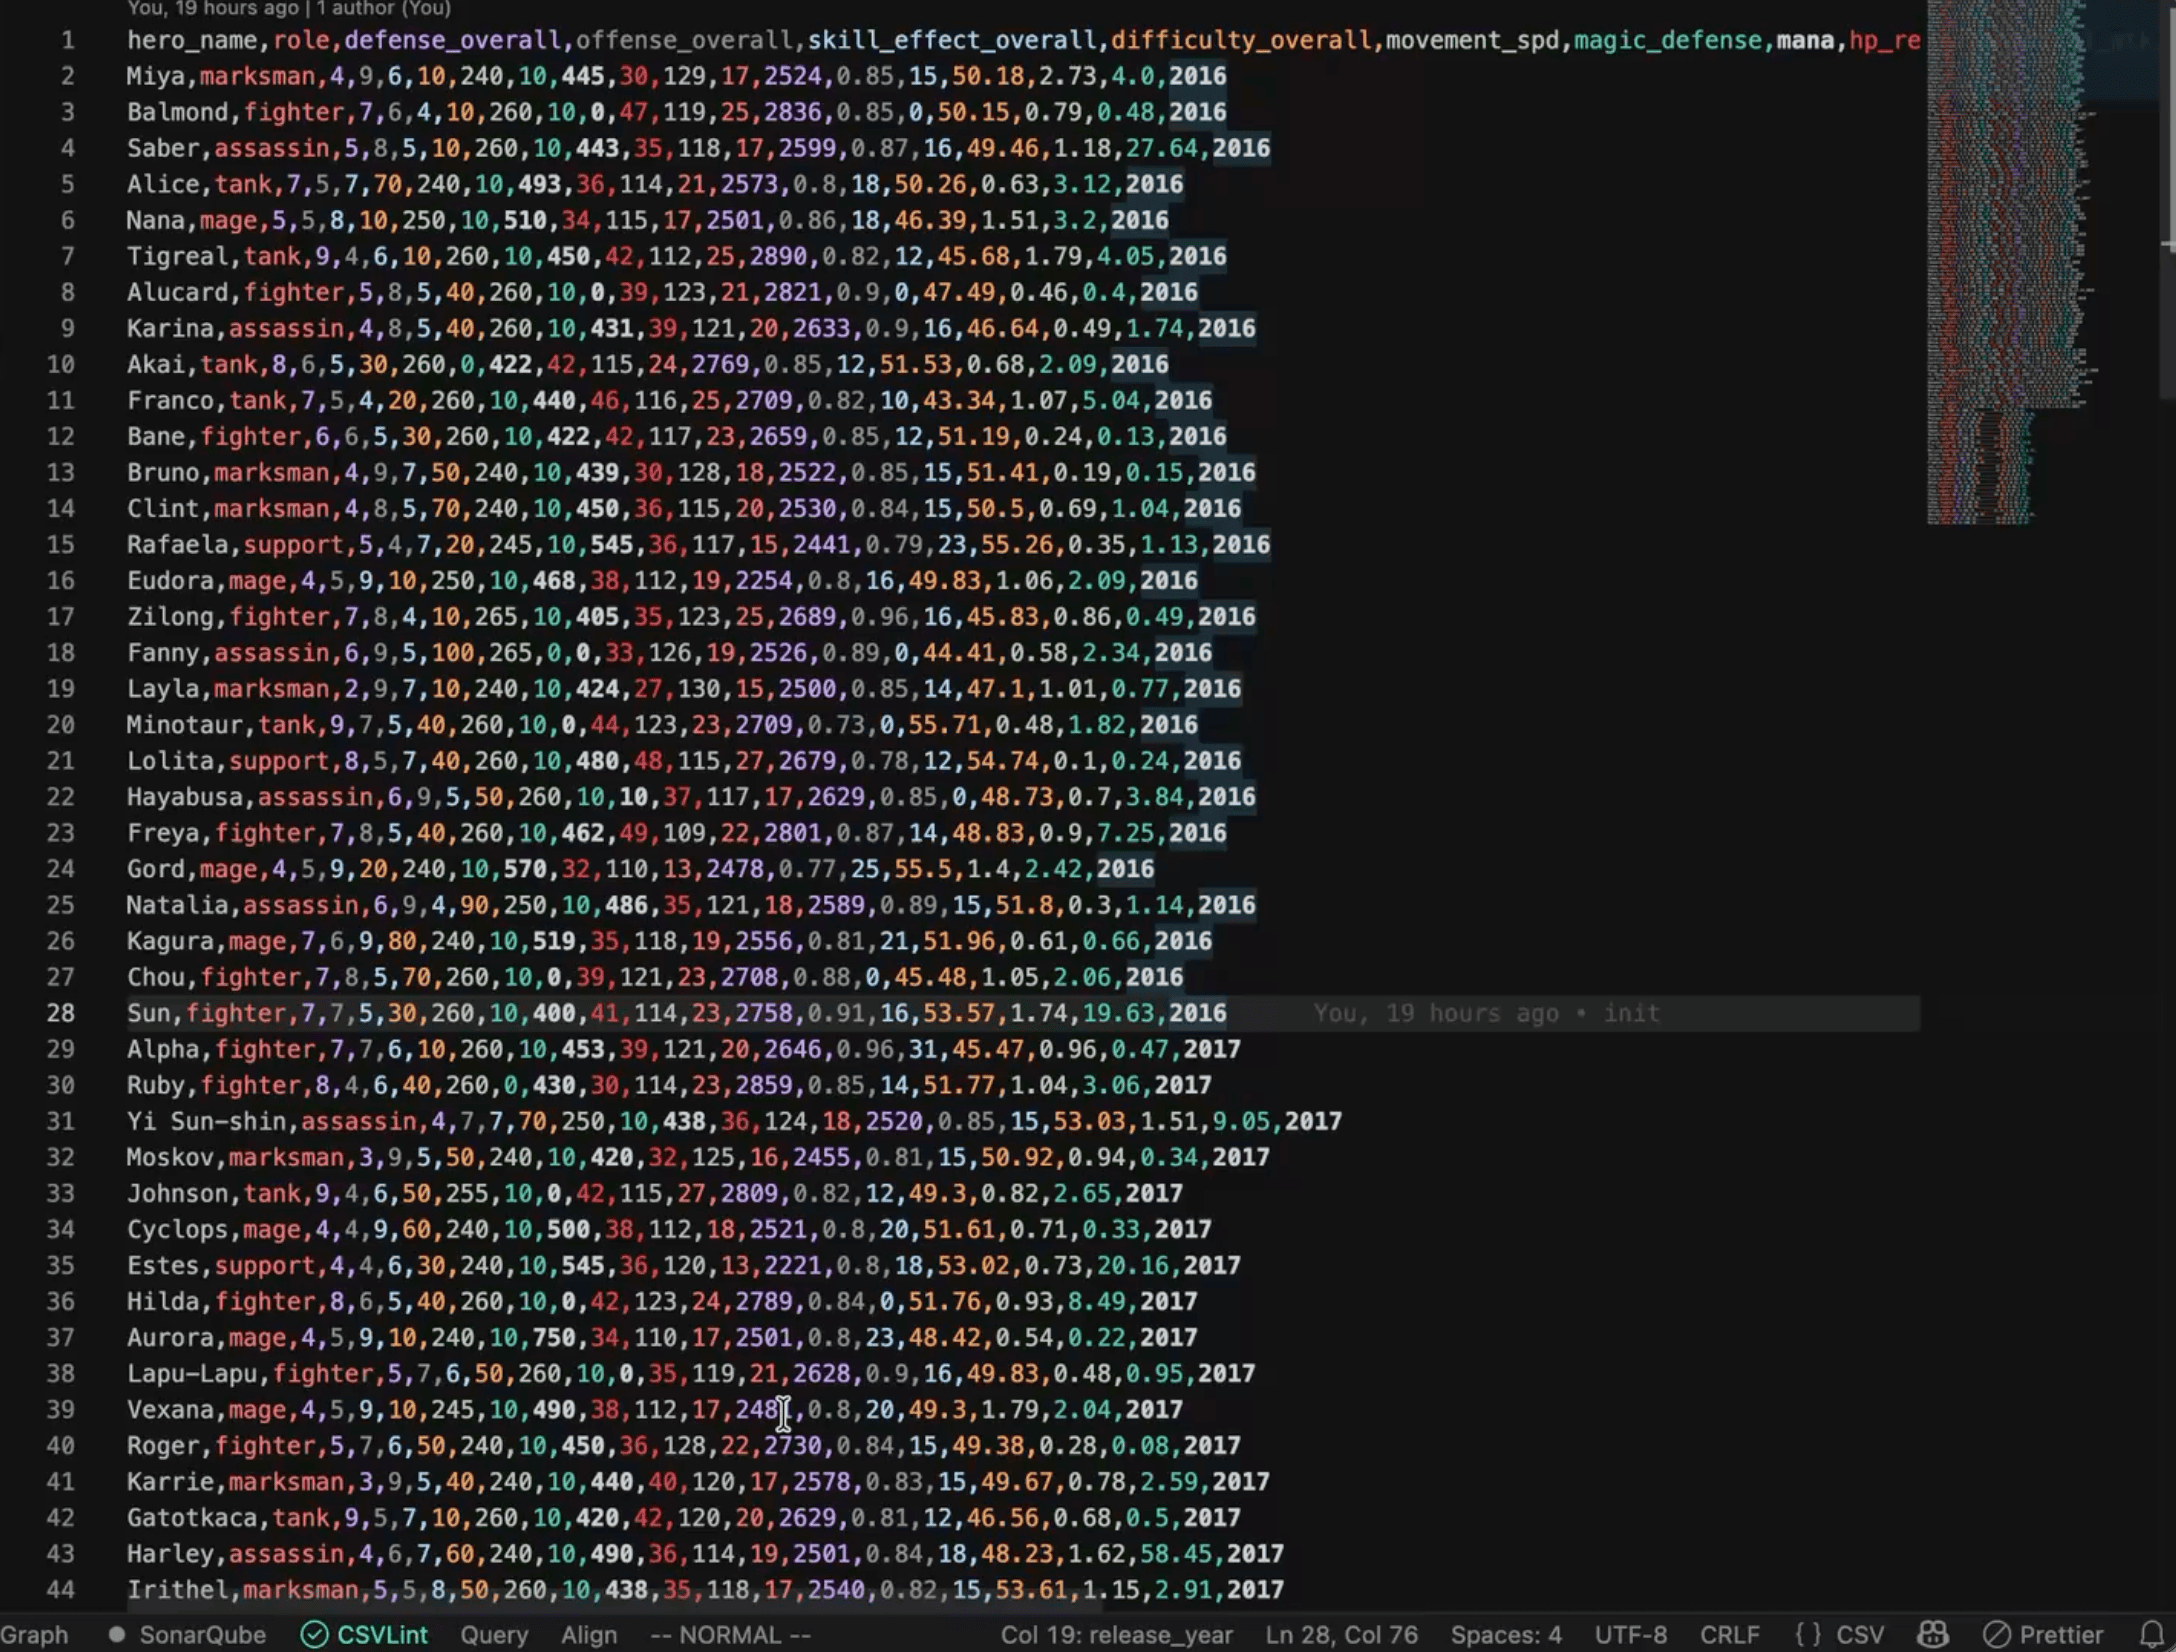
- Collect: Python grabs hero details and win/pick/ban stats.
- Combine: It matches everything up and fills some older fields from my 2021 CSV.
- Save: The result becomes
mlbb_hero_latest.csv. - Load: The website reads the CSV with Papa Parse.
- Explore: Chart.js draws the charts, and clicking filters updates them instantly.
Heads-up: Visitors never call the game’s data APIs. New stats mean a new CSV and a new deploy.
🕵️ The Scraper Is Sneakier Than It Looks
This is the part I underestimated. Getting the data was a little detective game 🔍.
- No hardcoded hero list. The scraper (about 550 lines of Python, standard library only) starts from the game’s own bootstrap config, follows it to the dynamic config, and discovers the current versioned hero list URL from there. So when the game updates its file paths, the scraper still finds them.
- Plan A and Plan B. Win, pick, and ban rates come from the official rank API (with pagination). If that’s unavailable, it falls back to the older rank CDN files.
- Knobs for days. Command-line options let me choose the rank tier, match type, page size, and request timeout.
- Old meets new. Hero names are normalized before matching, so the fresh data can merge cleanly with my 2021 baseline and keep the same column format.
- Bye, fake heroes. The game data had obvious placeholder entries like “Test Swordsman” and “Reserved String” 😂. They’re filtered out by default (you can include them with a flag if you’re curious).
- Tested. A few unit tests cover the scraper’s helper logic.
🤔 Decisions I Made (and What They Cost)
| Area | Current choice | Why it’s nice | Trade-off |
|---|---|---|---|
| Data collection | Python scraper | Easy to rerun | Needs a refresh process |
| Data storage | CSV file | Simple and portable | No built-in history |
| Frontend | Vite + TypeScript | Fast, lightweight | Work happens in the browser |
| Charts | Chart.js | Interactive out of the box | Less custom than D3 |
| Hosting | Static site | No always-on backend | Not live by default |
📊 What’s in the Dashboard?
| Feature | What it tells you |
|---|---|
| Win / Pick / Ban stats | How heroes perform and how often they’re chosen or banned |
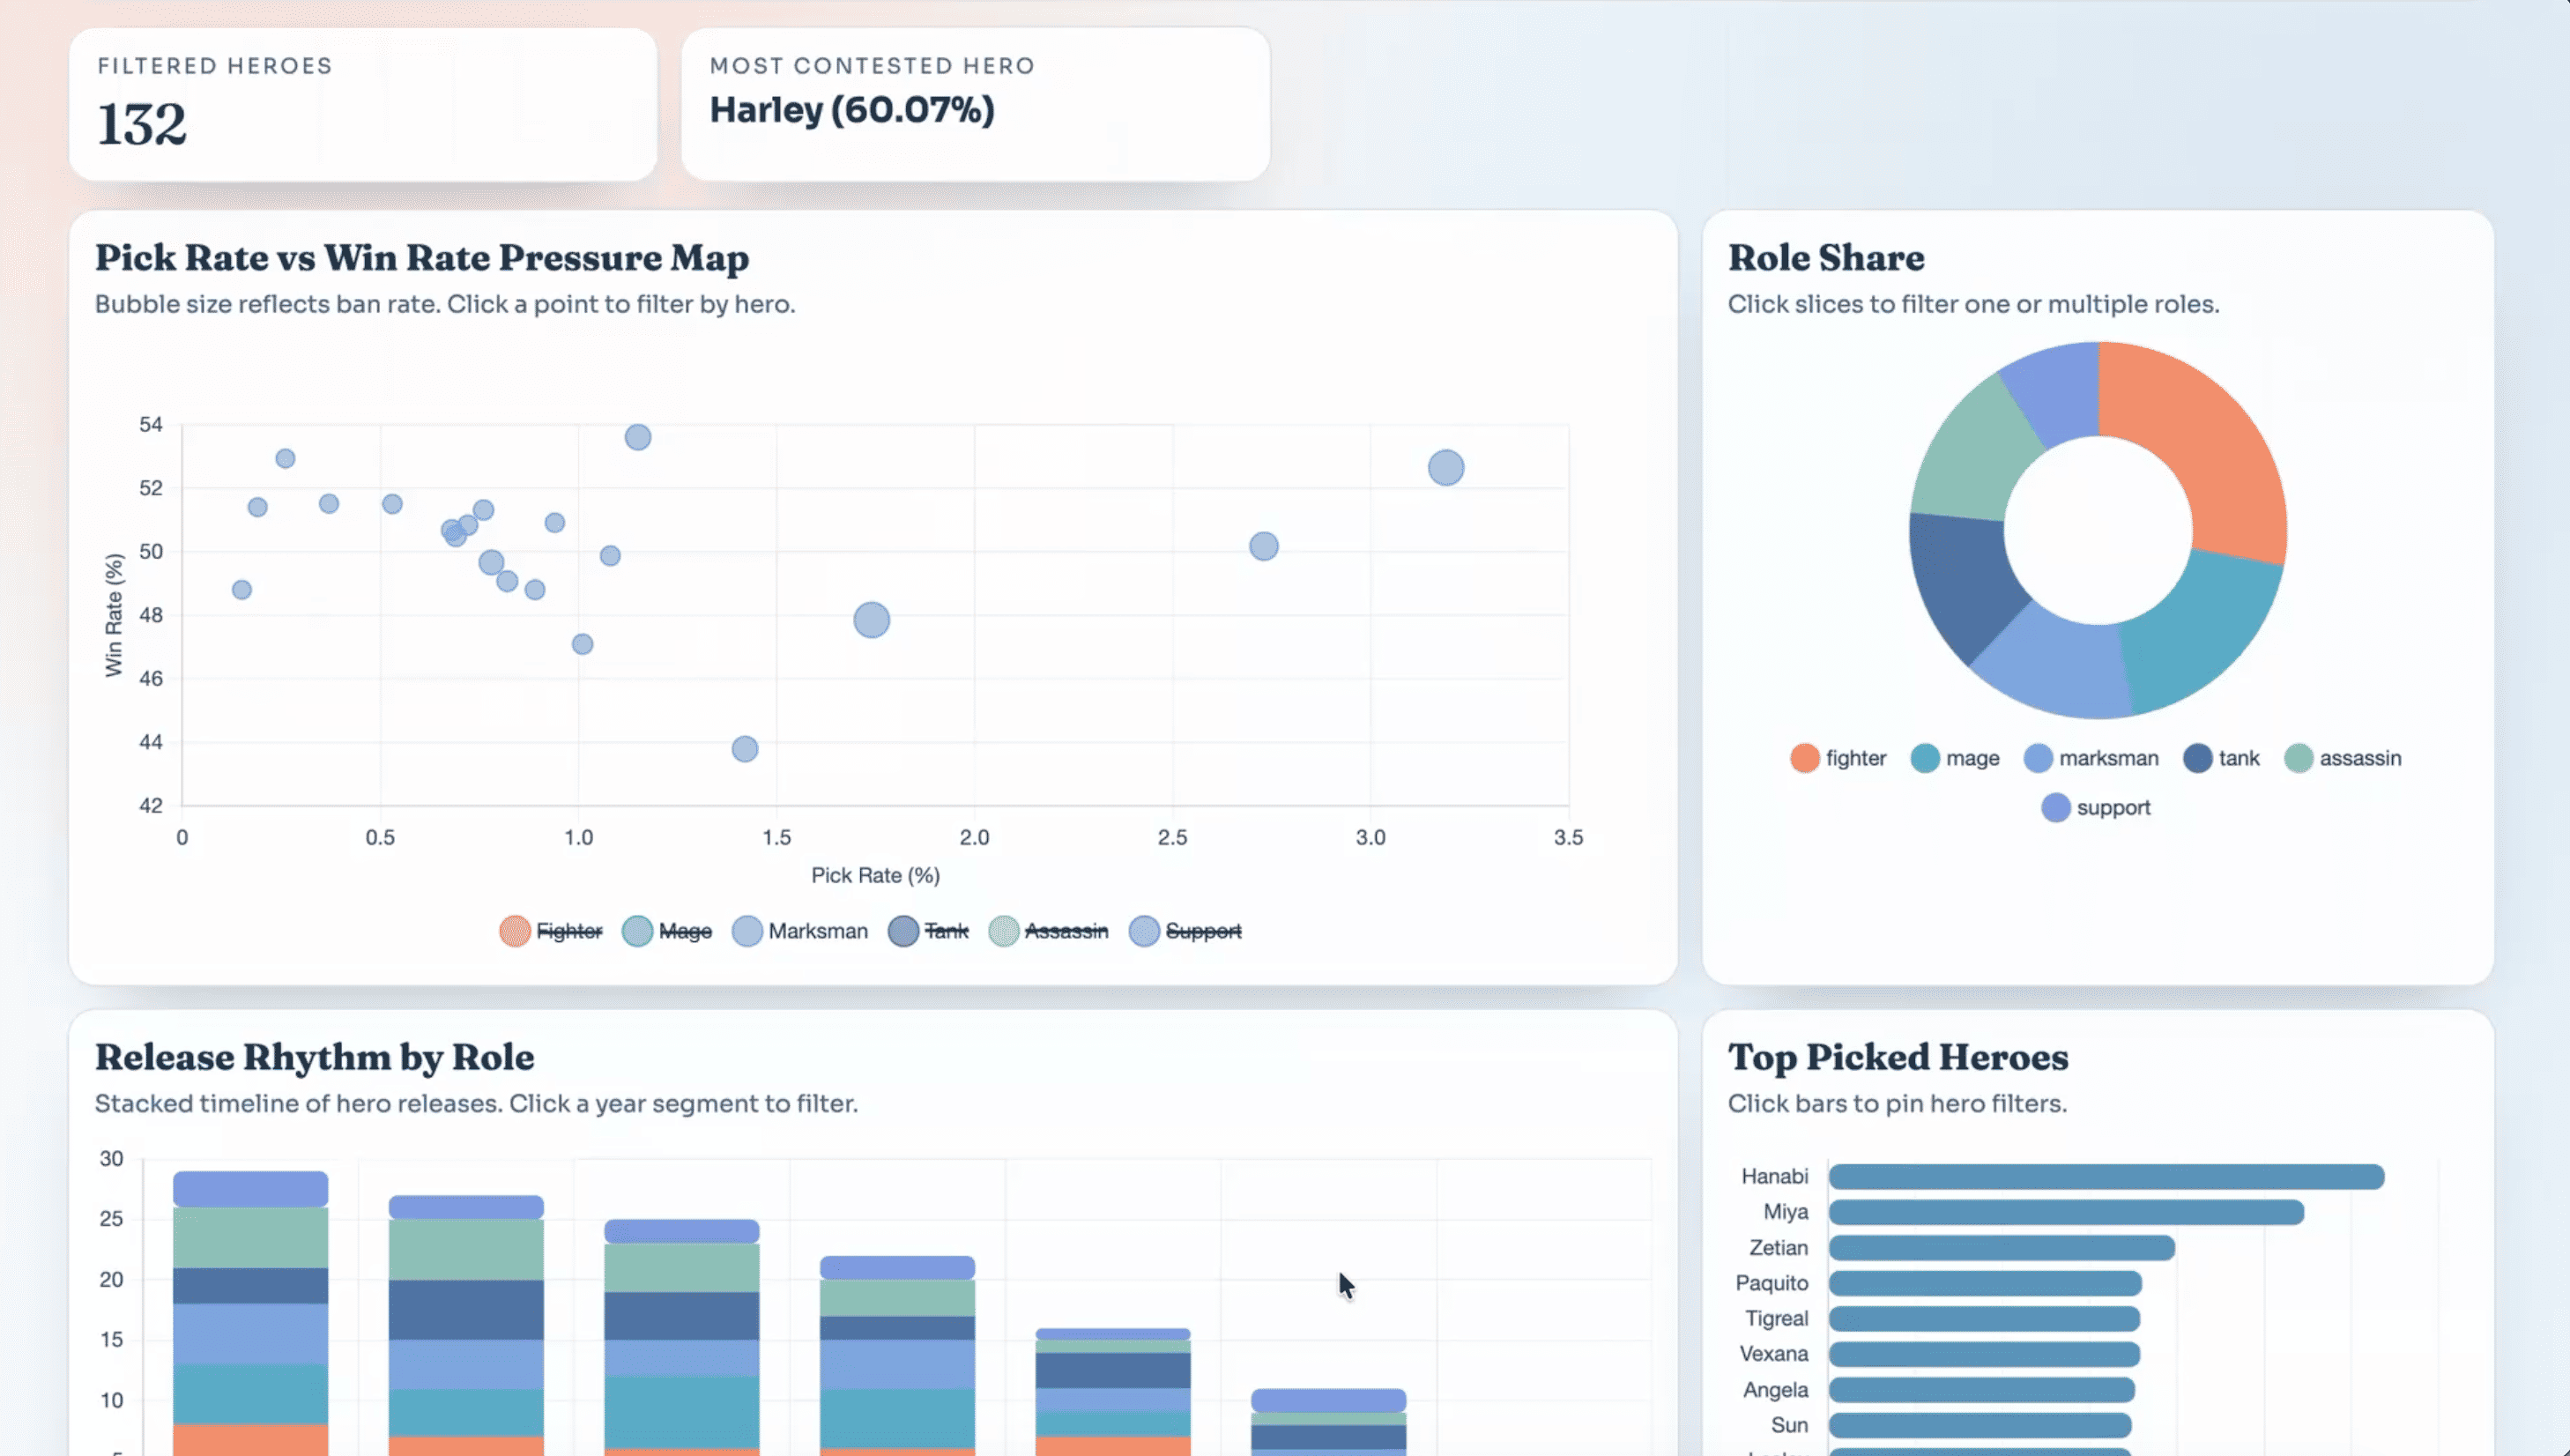
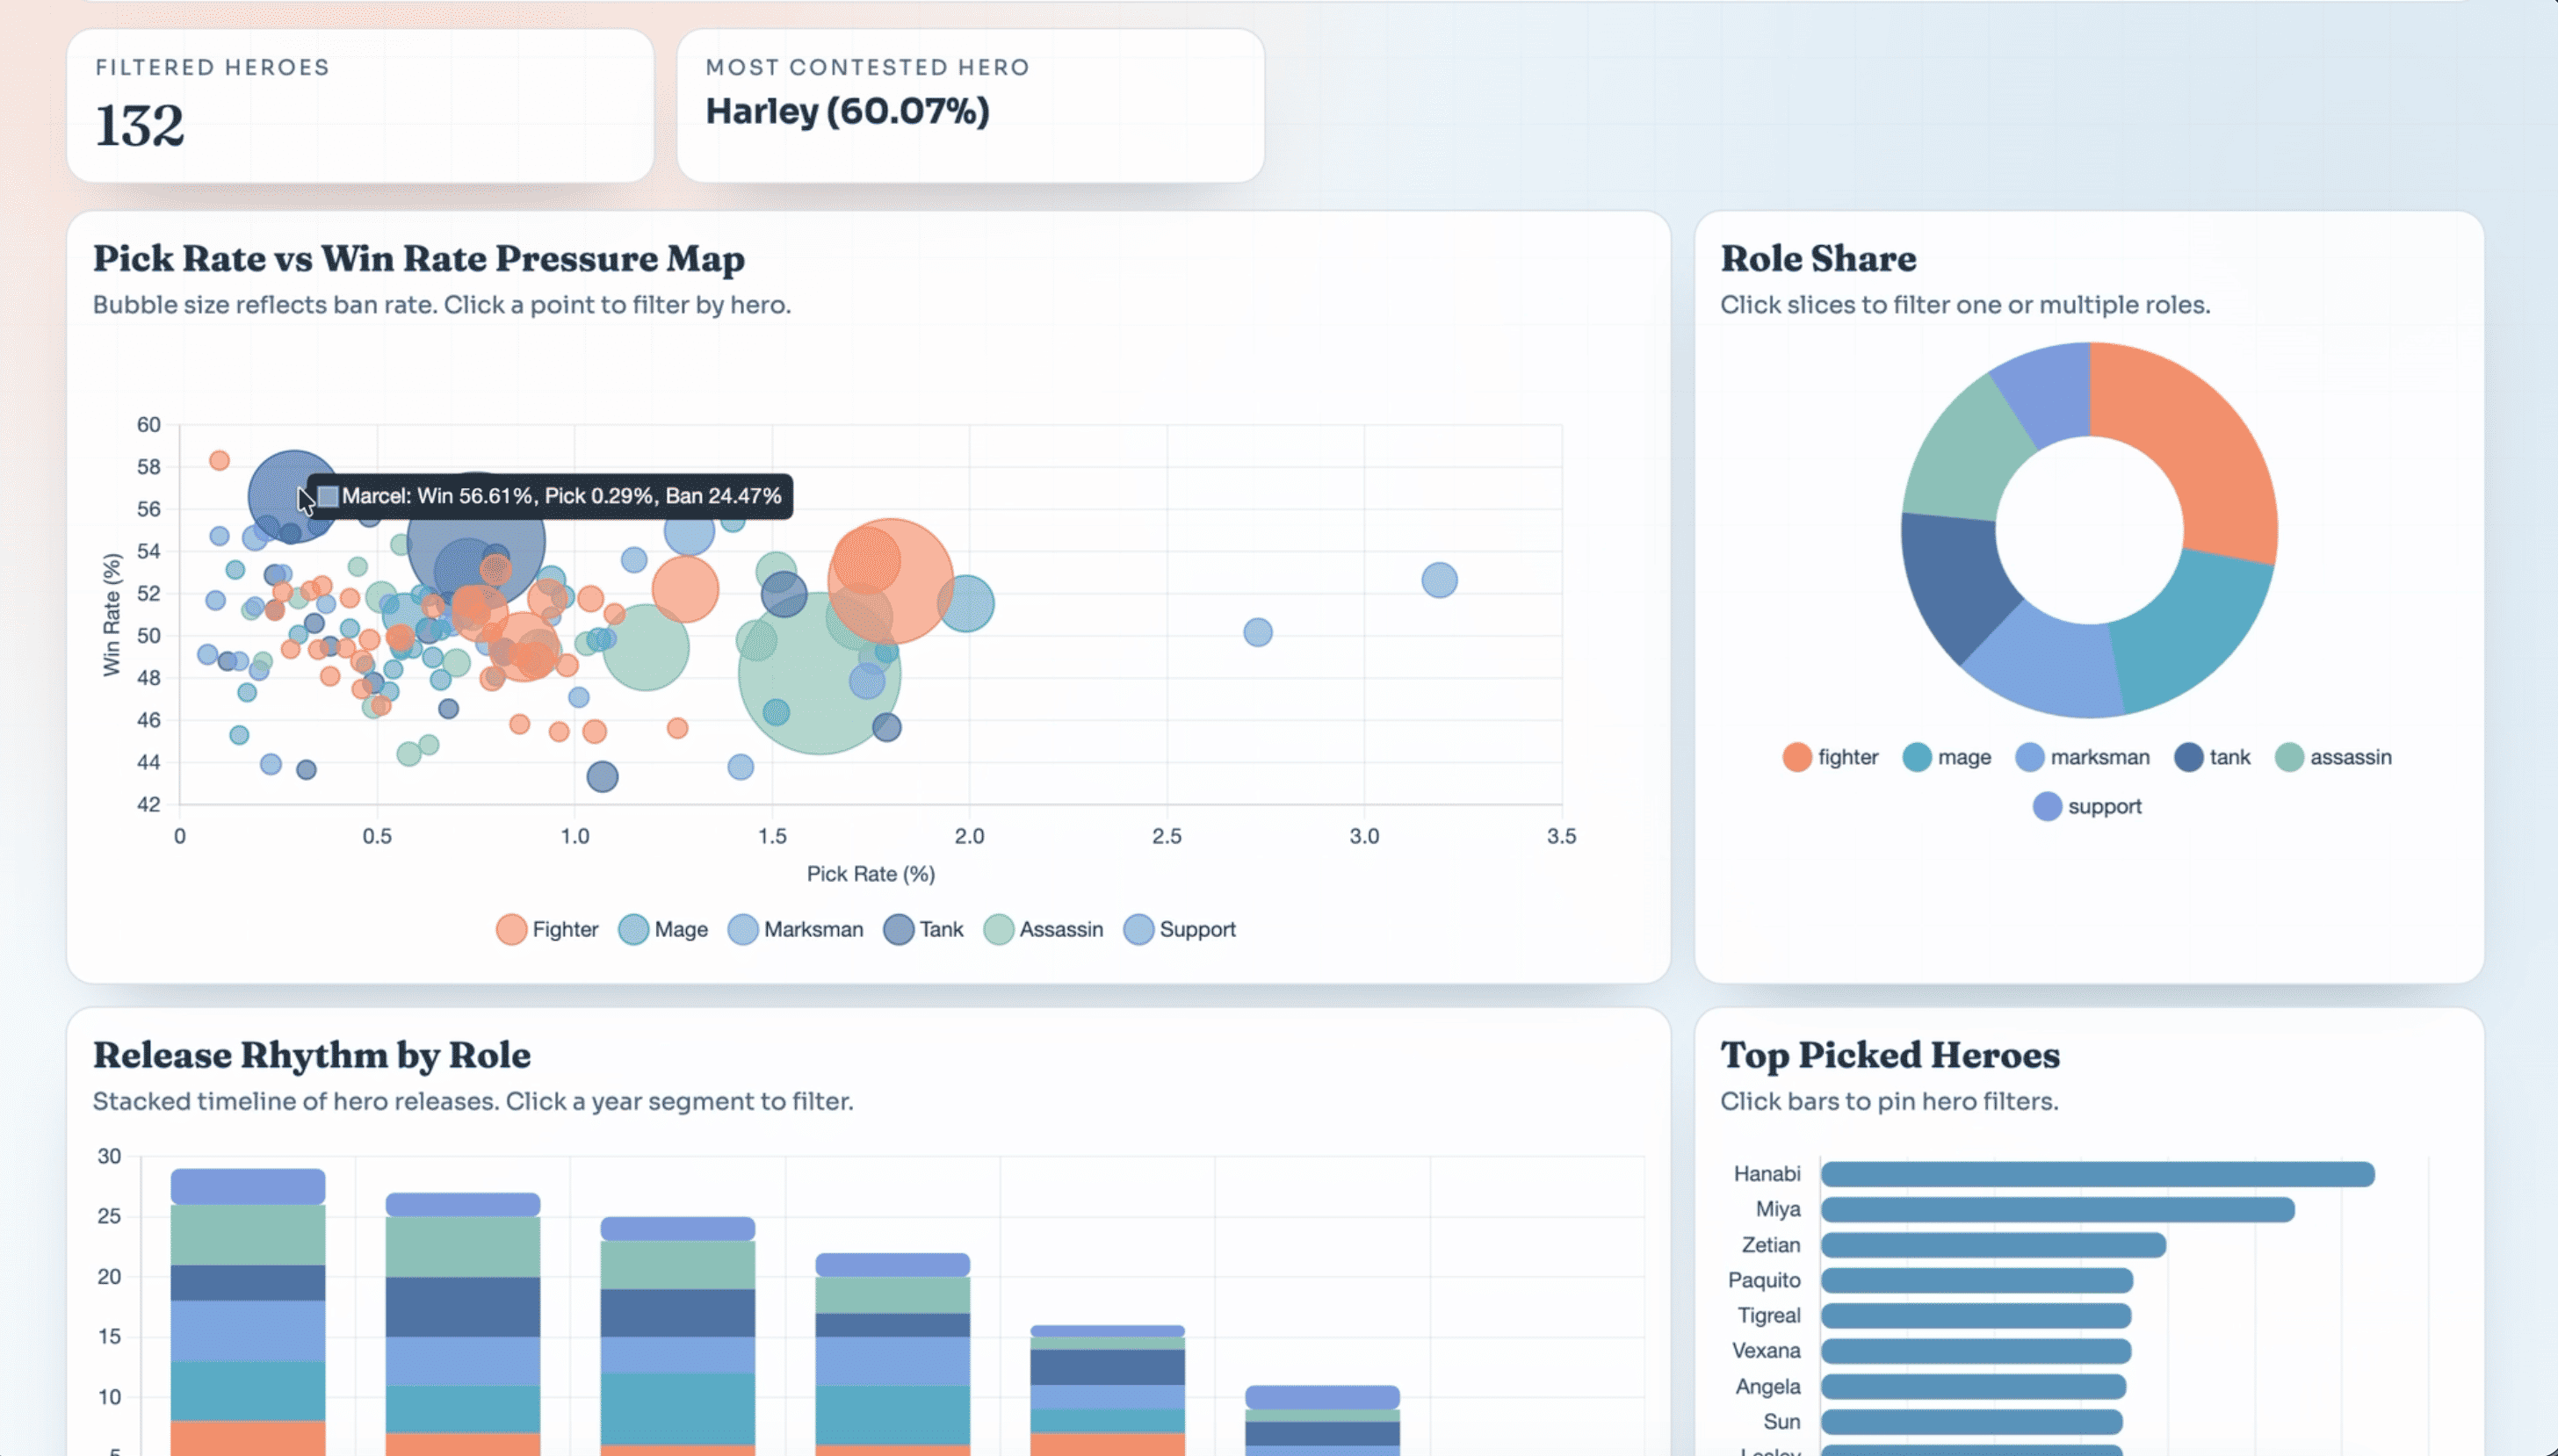
| Bubble chart | Pick rate vs. win rate, with ban pressure |
| Role & release charts | Hero mix by role and known release year |
| Top picked / banned | Quick hero rankings |
| Clickable filters | Focus on a role, year, or specific hero |
🔭 Okay, But How Do I Read It?
| What you see | How to read it |
|---|---|
| Summary cards | Filtered Heroes is the count. Average Win/Pick shows up after you filter. Most Contested has the highest pick rate + ban rate. |
| Pick vs. Win bubbles | Compare popularity, win rate, and ban pressure. See the corner guide below. |
| Role Share | Bigger slice = more heroes in that role, not a stronger role. |
| Release Rhythm | Taller stacked bar = more heroes released that year; colors separate roles. |
| Top Picked / Banned | Longer bar = higher pick or ban rate. Popular doesn’t always mean powerful. |
| Meta Insights + Leaderboard | Quick highlights and a combined impact score based on win (20%), pick (45%), and ban (35%). |
🫧 The Bubble Chart, Explained
Each bubble is one hero. Its position shows popularity and performance, and its size shows how often it gets banned.
- X-axis (Pick Rate): Further right = picked more often.
- Y-axis (Win Rate): Higher up = wins more often.
- Bubble size (Ban Rate): Bigger = banned more often.
| Position | What it means | If the bubble is big… |
|---|---|---|
| ↗ Top-right | Popular and wins a lot. Likely a strong meta pick. | Highly contested: picked often and banned often. |
| ↖ Top-left | Rarely picked but wins a lot. Could be a hidden gem or niche pick. | Often banned despite fewer picks; bans might limit opportunities to pick it. |
| ↘ Bottom-right | Popular but wins less. Common pick, mixed results. | Still attracts bans, possibly due to annoying matchups or reputation. |
| ↙ Bottom-left | Rarely picked and wins less. Usually a situational or lower-priority pick. | May face targeted bans even if its overall results look weak. |
Quick takeaway: a big bubble doesn’t automatically mean a strong hero. It just means it gets banned a lot (maybe everyone’s just tired of facing it, lol). Read all three stats together. And remember, corners are relative to the other heroes on screen, especially after filtering.
Try it: Click a role, year, or hero to filter the charts. See what changes, then hit Reset all filters to start over.
Keep in mind: A high win rate with only a few picks isn’t proof that a hero is the best. This is a data snapshot, not match-by-match analysis. Heroes with a missing release year may show up as 0.
💸 Cost & Performance Tips
| Part | Keep it simple by… |
|---|---|
| Hosting | Using static hosting and CDN caching |
| CSV | Compressing and caching the file |
| Charts | Keeping browser rendering lightweight |
| Data updates | Refreshing on a schedule instead of every visit |
- Cost advantage: No running server or database needed for the current dashboard.
- Honest note: Actual monthly cost depends on hosting and traffic, and I don’t have billing data to share.
🔮 What’s Next?
| Idea | Change | Good for |
|---|---|---|
| Auto refresh | Schedule the Python script | Keeping stats more current |
| Data history | Save dated CSV snapshots | Comparing trends over time |
| Quality checks | Validate missing and unusual values | More reliable charts |
| API + database | Add a backend later | Larger data and advanced queries |
📝 Design Journal, in a Nutshell
- Problem: Hero stats are scattered and hard to compare quickly.
- Choice: Collect once with Python, publish as CSV, explore in a static dashboard.
- Why it works: Simple setup, fast filtering, and fewer things to maintain.
- Trade-off: It’s a snapshot, not real-time data.
- Next improvement: Show missing release years as Unknown, display the real update date, and automate the CSV refresh.