Portfolio / notes / experiments

Christina

Engineer, creative, and a happy documenter

Software Engineer with 3+ years of experience building enterprise applications. I work mainly with Angular, Kotlin, and Spring Boot. I also explore cybersecurity, data analytics, and UI/UX to sharpen how I build and solve problems.

More About Me

I bring tech and art together. ݁ ⟡ ݁₊ ݁

I explore illustration, design, dataviz, basic animation, motion design (Rive, Lottie), 3D (Blender), video editting, and music instruments.

I have a lot of ideas, so I keep learning new creative tools to turn them into something real (and helpful).

To share them with the world, I started creating content on TikTok in 2026 and reached 200K organic views in my first three months. Since then, I’ve also had the chance to collaborate with tech-focused brands on creative content.

Loading illustration…

01 / Toolkit

Skills

The tools I use, what I build with, and where AI helps along the way.

Tech Stack

The core technologies I use to build products across frontend, backend, mobile, and data.

  • AngularFrontend
  • ReactFrontend
  • NextFrontend + Backend
  • Spring BootBackend
  • C# / .NETBackend
  • Java / KotlinMobile
  • FlutterMobile
  • SQLData
  • PythonData + automation

AI & Agentic Tools

Tools and platforms I explore for coding, agents, automation, and AI-powered applications.

  • Github CopilotAgentic coding
  • OpenclawMulti-agent Orchestrations
  • Hermes AgentAgent experiments
  • n8nAI automation
  • MCPAgent integration
  • Hugging FaceModel experiments

What I Do Too

Things I enjoy exploring beyond traditional software development.

  • Data AnalyticsInsights + dashboards
  • Web Vulnerability AssessmentCybersecurity
  • UI / UX DesignProduct design
  • AI App DevelopmentLLM apps + integrations
  • AI Workflow AutomationAgents + n8n
  • Motion DesignRive + Lottie
  • 3D DesignBlender

02 / Selected

Showcase

A little collection of things I’ve built, and I thought were worth sharing.

Flow diagram of the self-updating CV pipeline
Projects

A CV That Updates Itself (Hopefully)

I never remember what I worked on when it's time to update my CV. So I built a small pipeline - a spreadsheet journal, a monthly bot, RenderCV, and a pull request I approve myself.

techAIspreadsheetweb
Projects

Hermes × WhatsApp: My Brain-Dump Executor

I dump everything into my WhatsApp chat with myself. Now I have an AI agent that actually does something with it.

hermesAItech
Projects

3D Isometric Room Web

A playful alternative to the usual portfolio page, an original room modeled in Blender and brought to life with Three.js and a little animation.

blender3dwebtech
Projects

Decision Maker: 9 Tools for Better Choices

Sometimes choosing between a few options is harder than it should be. I built Decision Maker, a web app that brings simple, measurable ways to compare options and make better decisions into one place.

nextreactAItech

03 / Built

Projects

Tools, prototypes, and systems that were worthy enough to become more than a sketch.

Projects

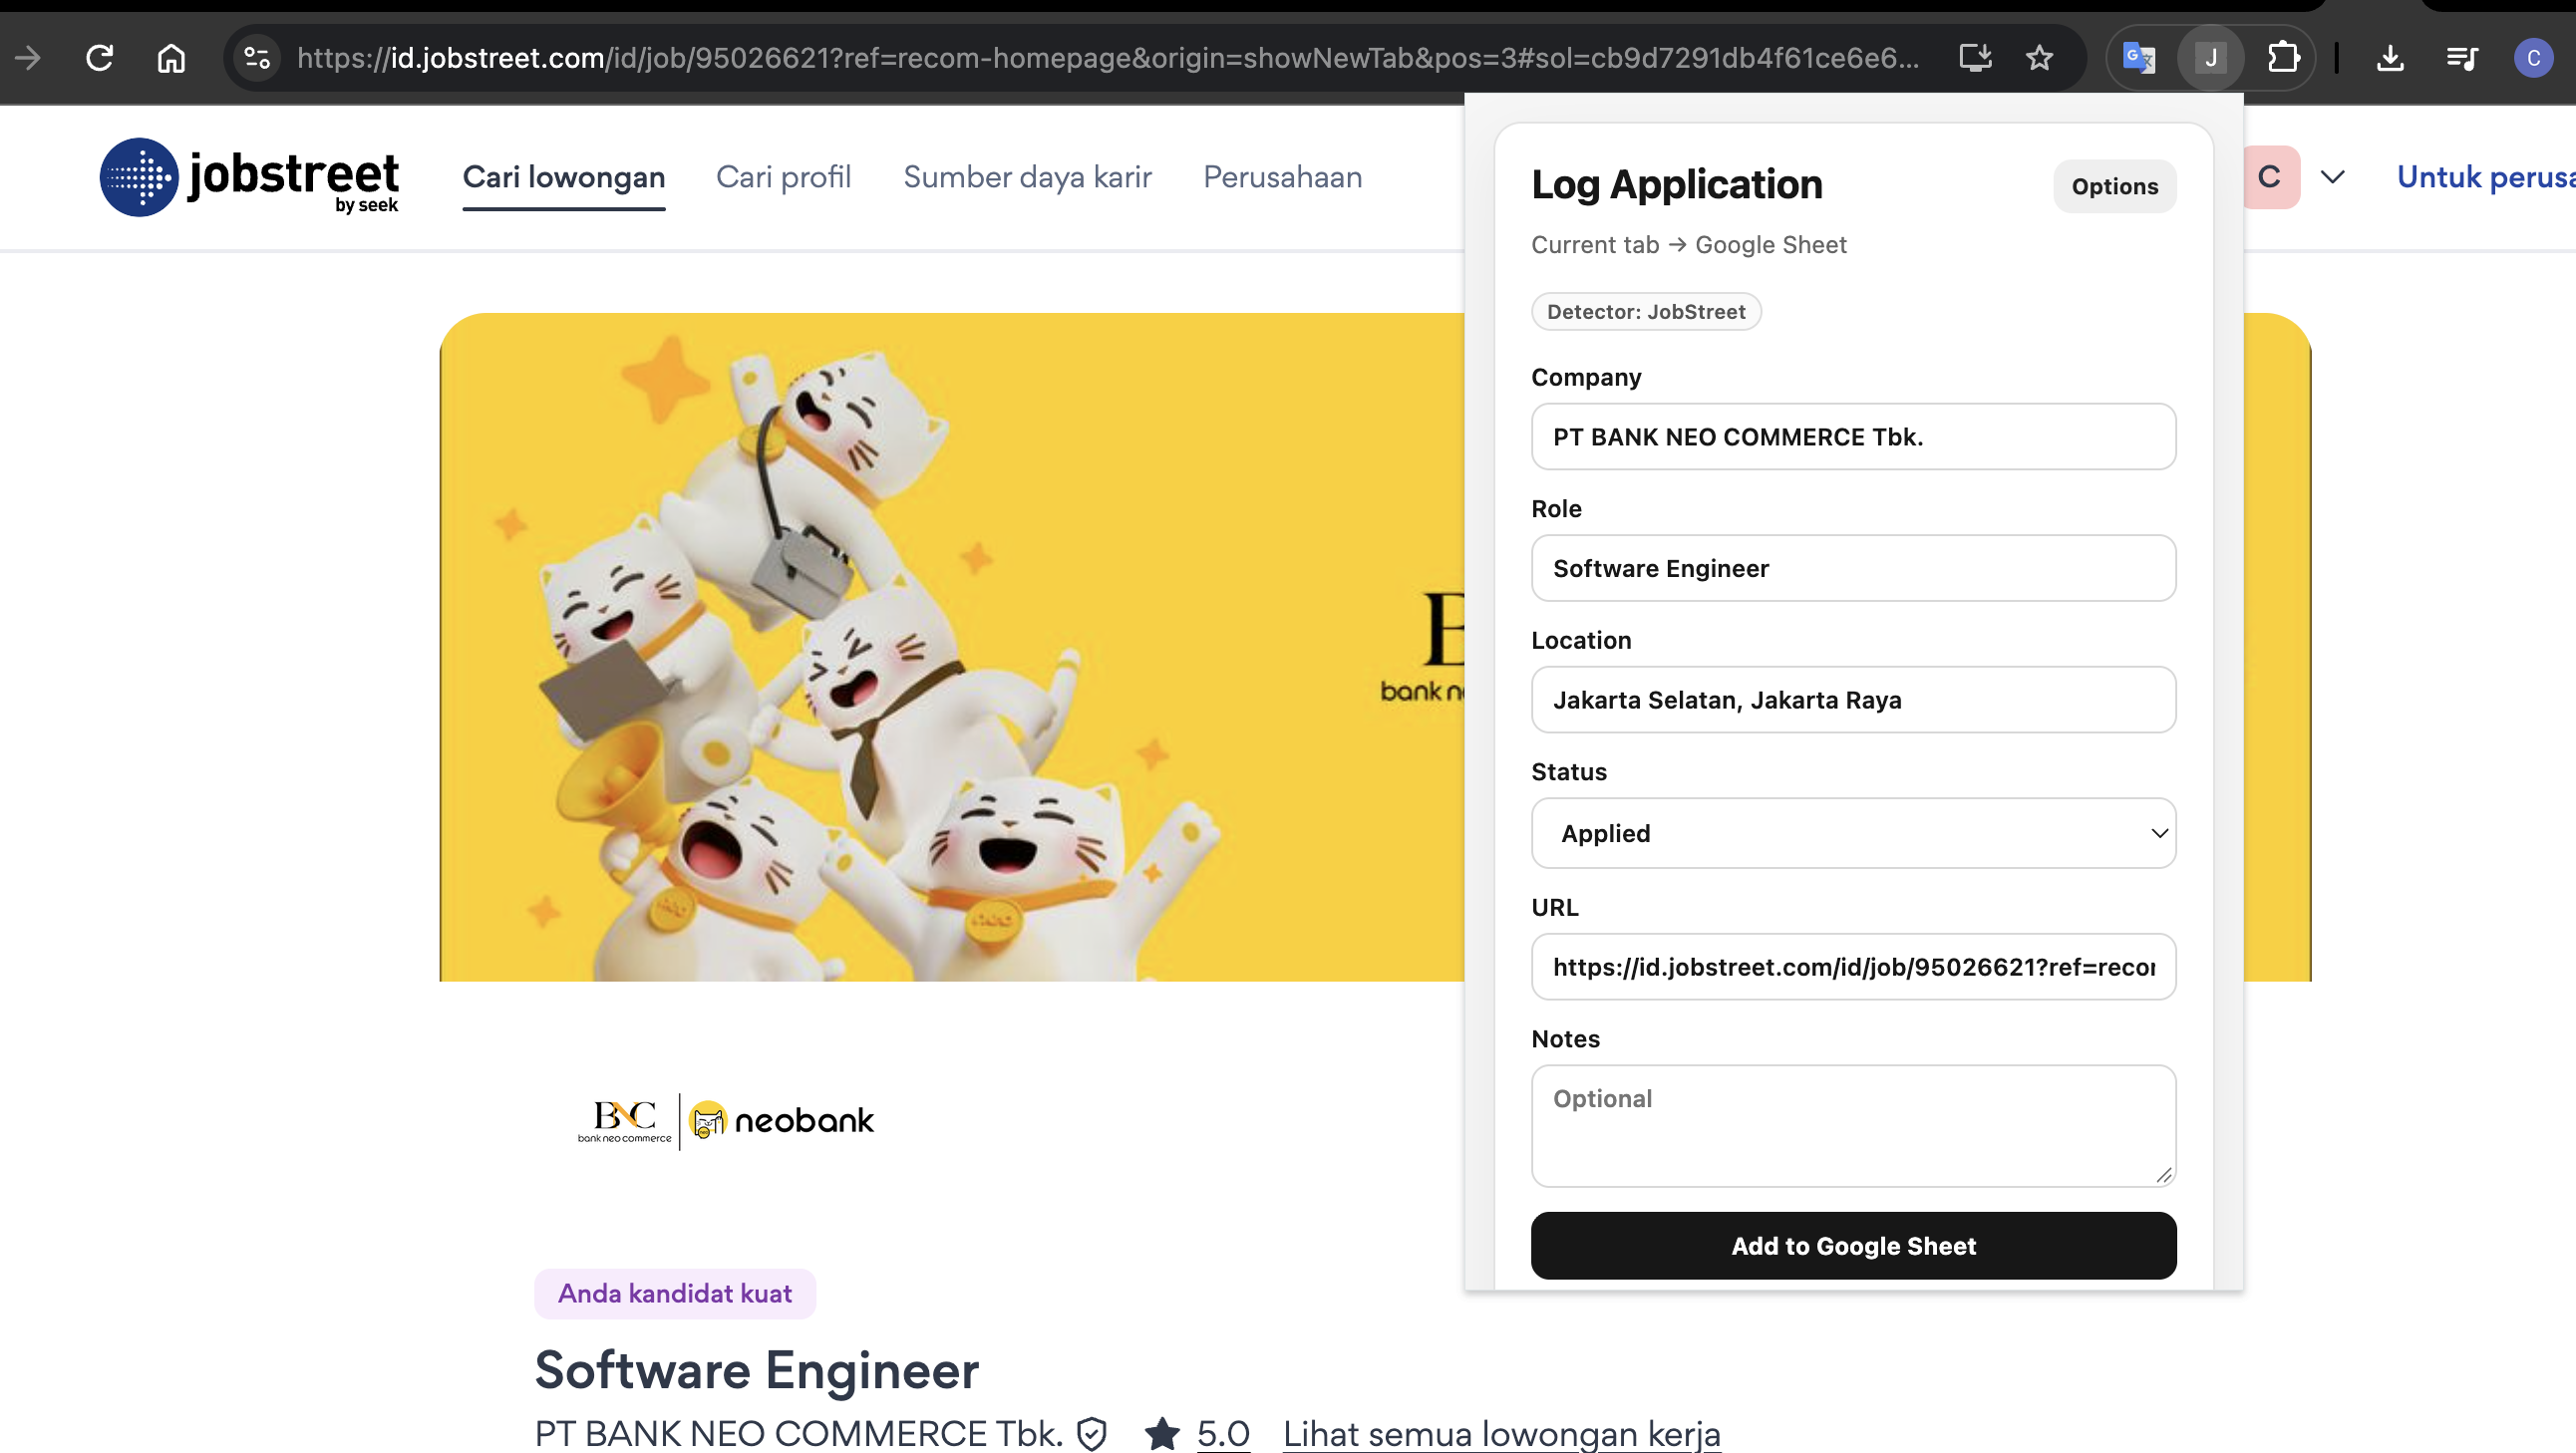
Job Application Logger: Track Applications Without the Copy-Paste

A lightweight Chrome extension that saves job applications to Google Sheets, with a quick manual option and automatic logging when supported job sites confirm a submission.

extensionstechspreadsheet
Projects

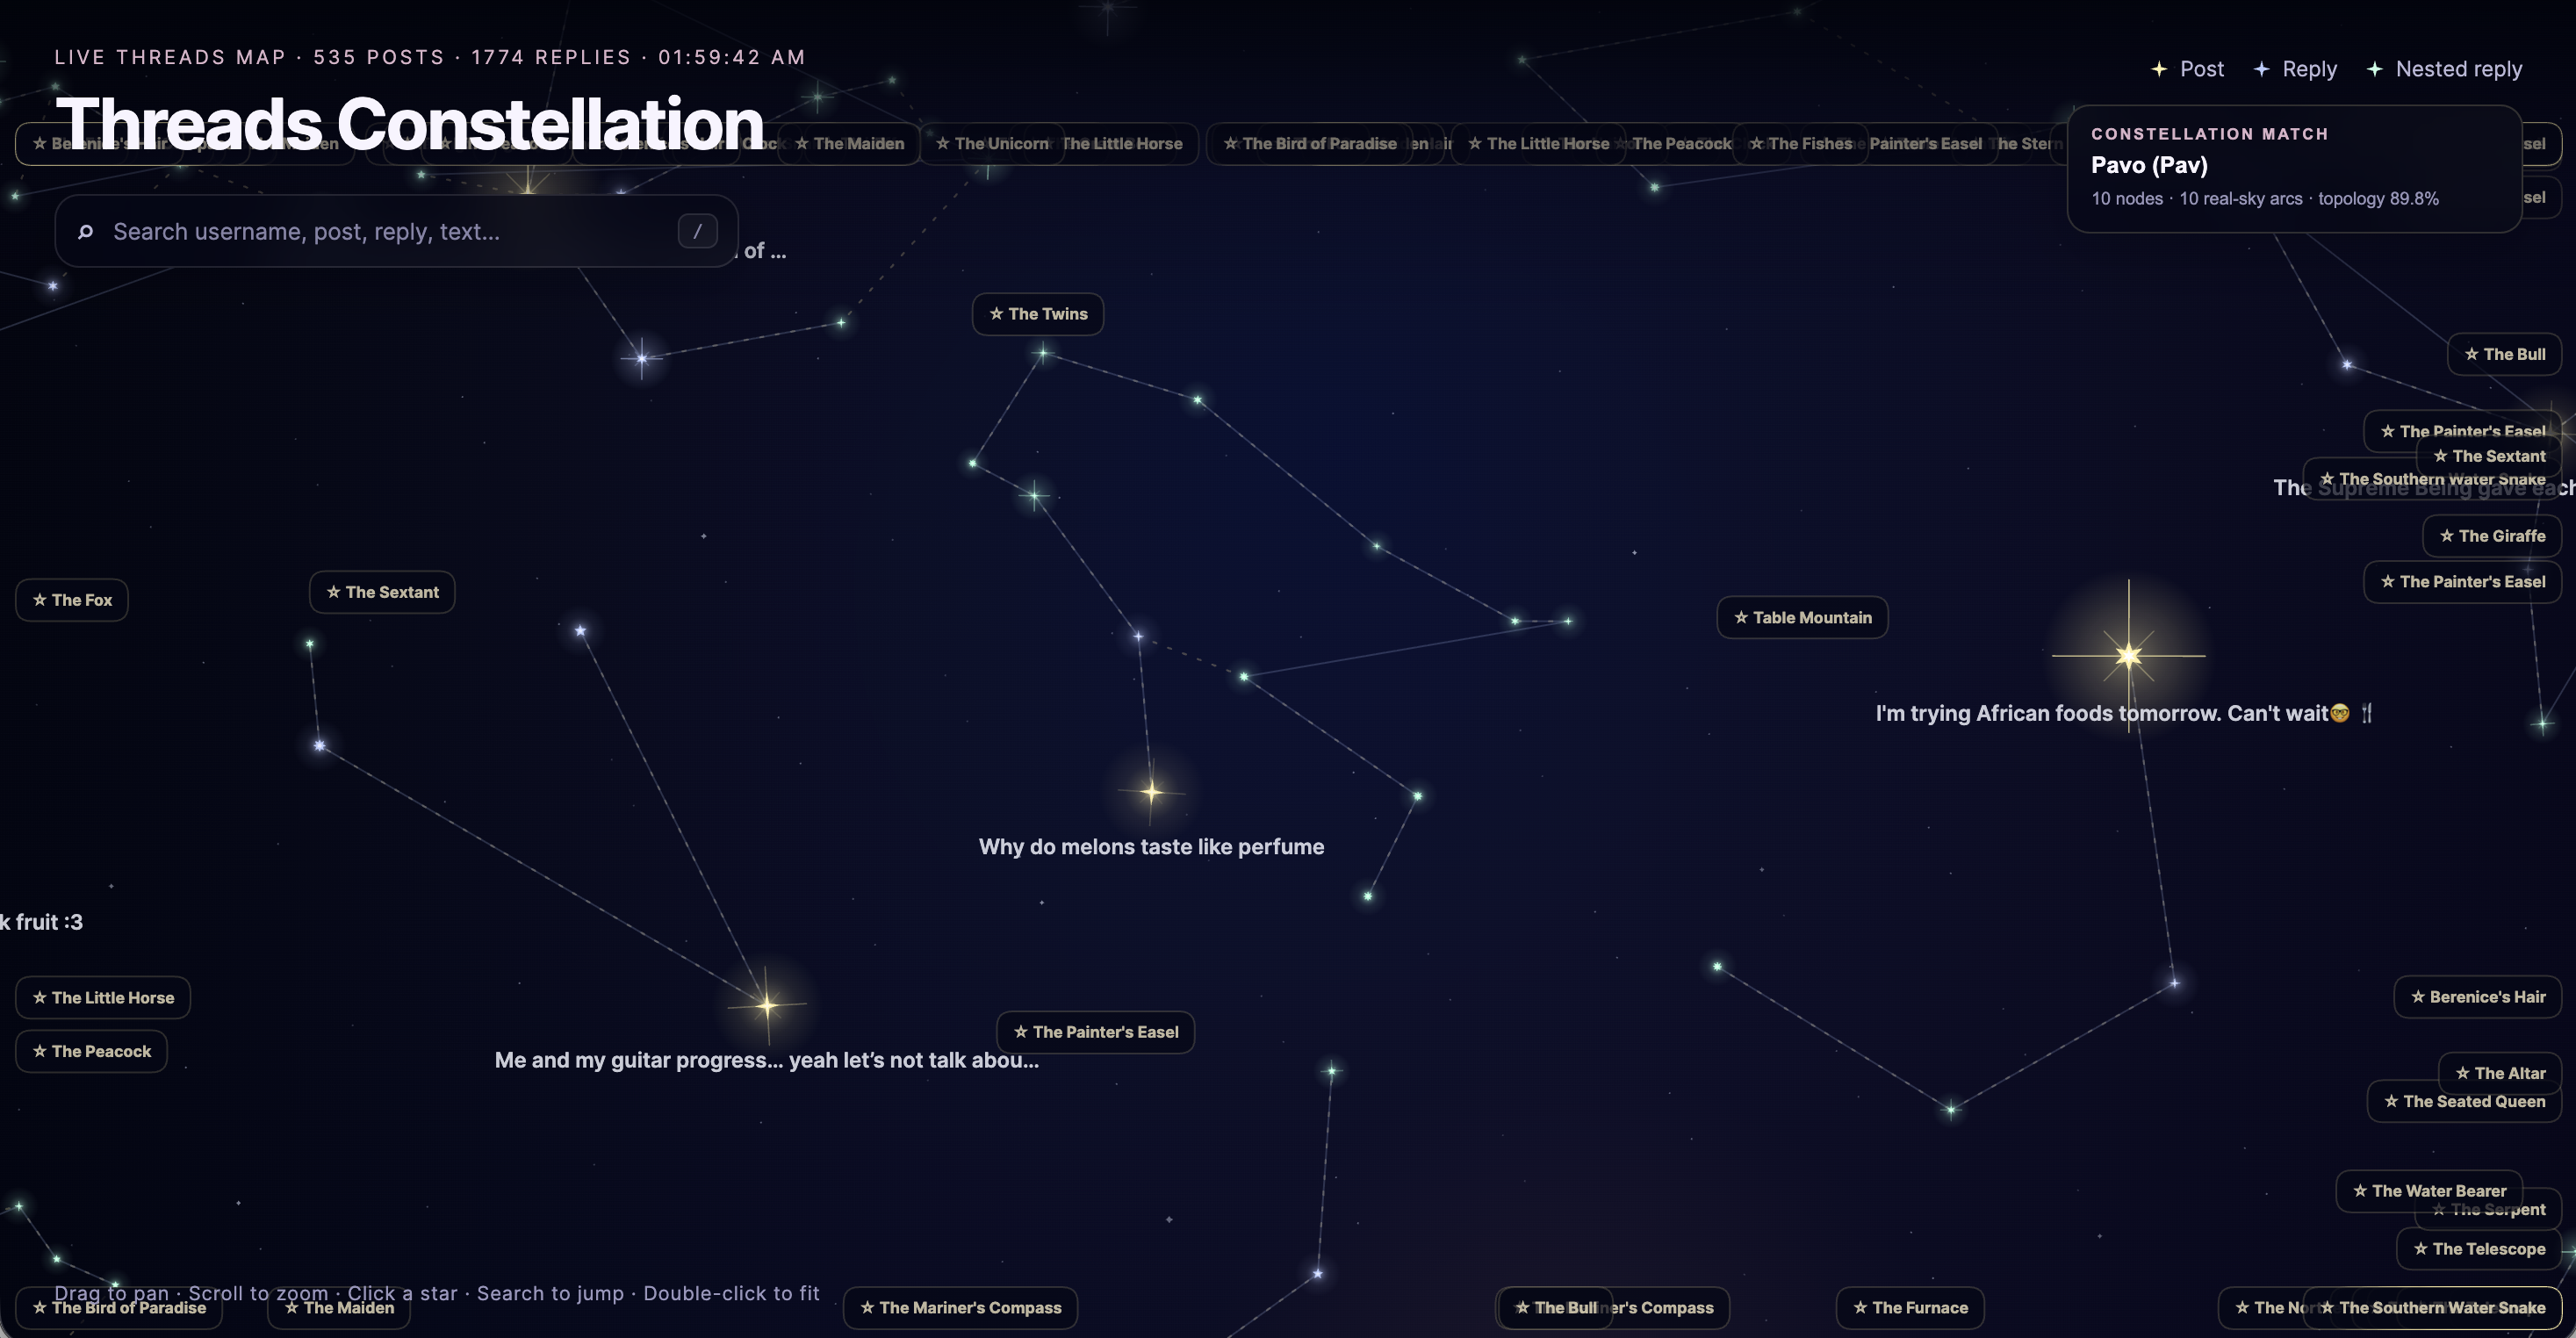
Threads Constellation: Turning Conversations Into a Night Sky

An interactive map that transforms Threads posts and replies into connected stars, with real constellation patterns hidden among the conversations.

webdata visualizationnetwork visualizationtech
Projects

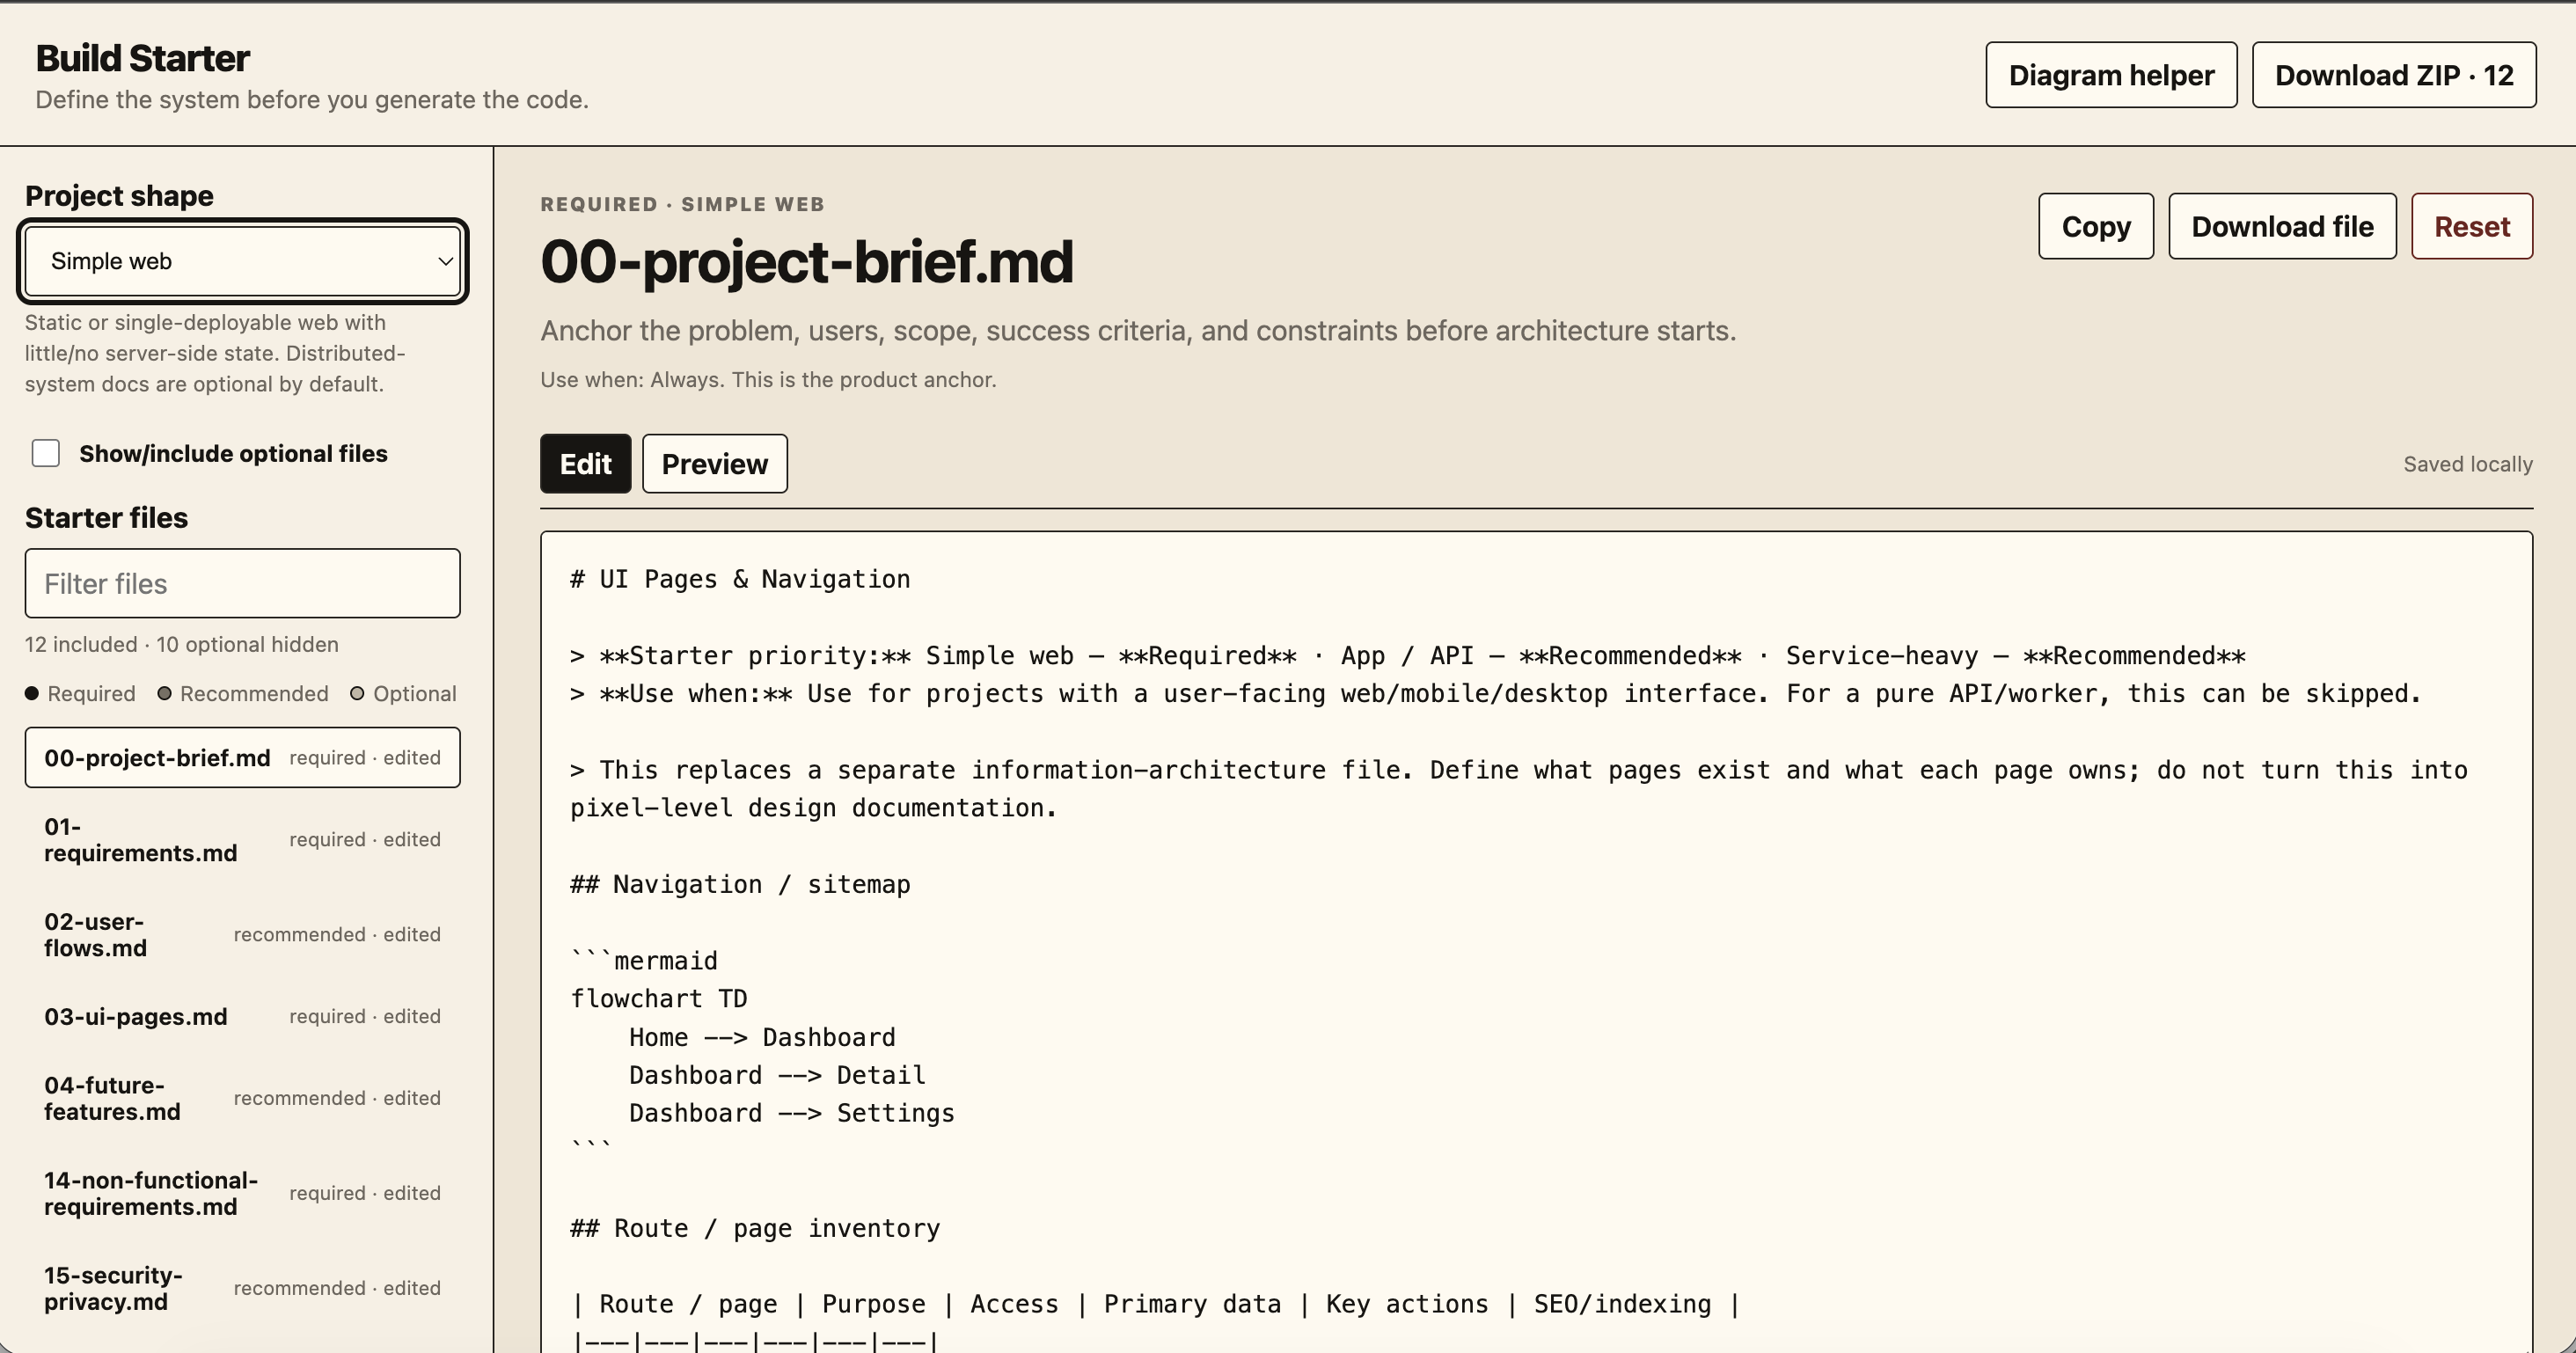
Build Starter: Plan the App Before AI Writes the Code

An open-and-go, browser-based toolkit for turning rough software ideas into clear Markdown specs, architecture diagrams, and an AI-ready project handoff.

webAItech
Projects

Effort to Buy: What Does a Purchase Cost in Work Hours?

An interactive way to compare affordability across countries--not just by price, but by how long someone earning minimum wage would need to work to afford it.

data analysiswebtech
Projects

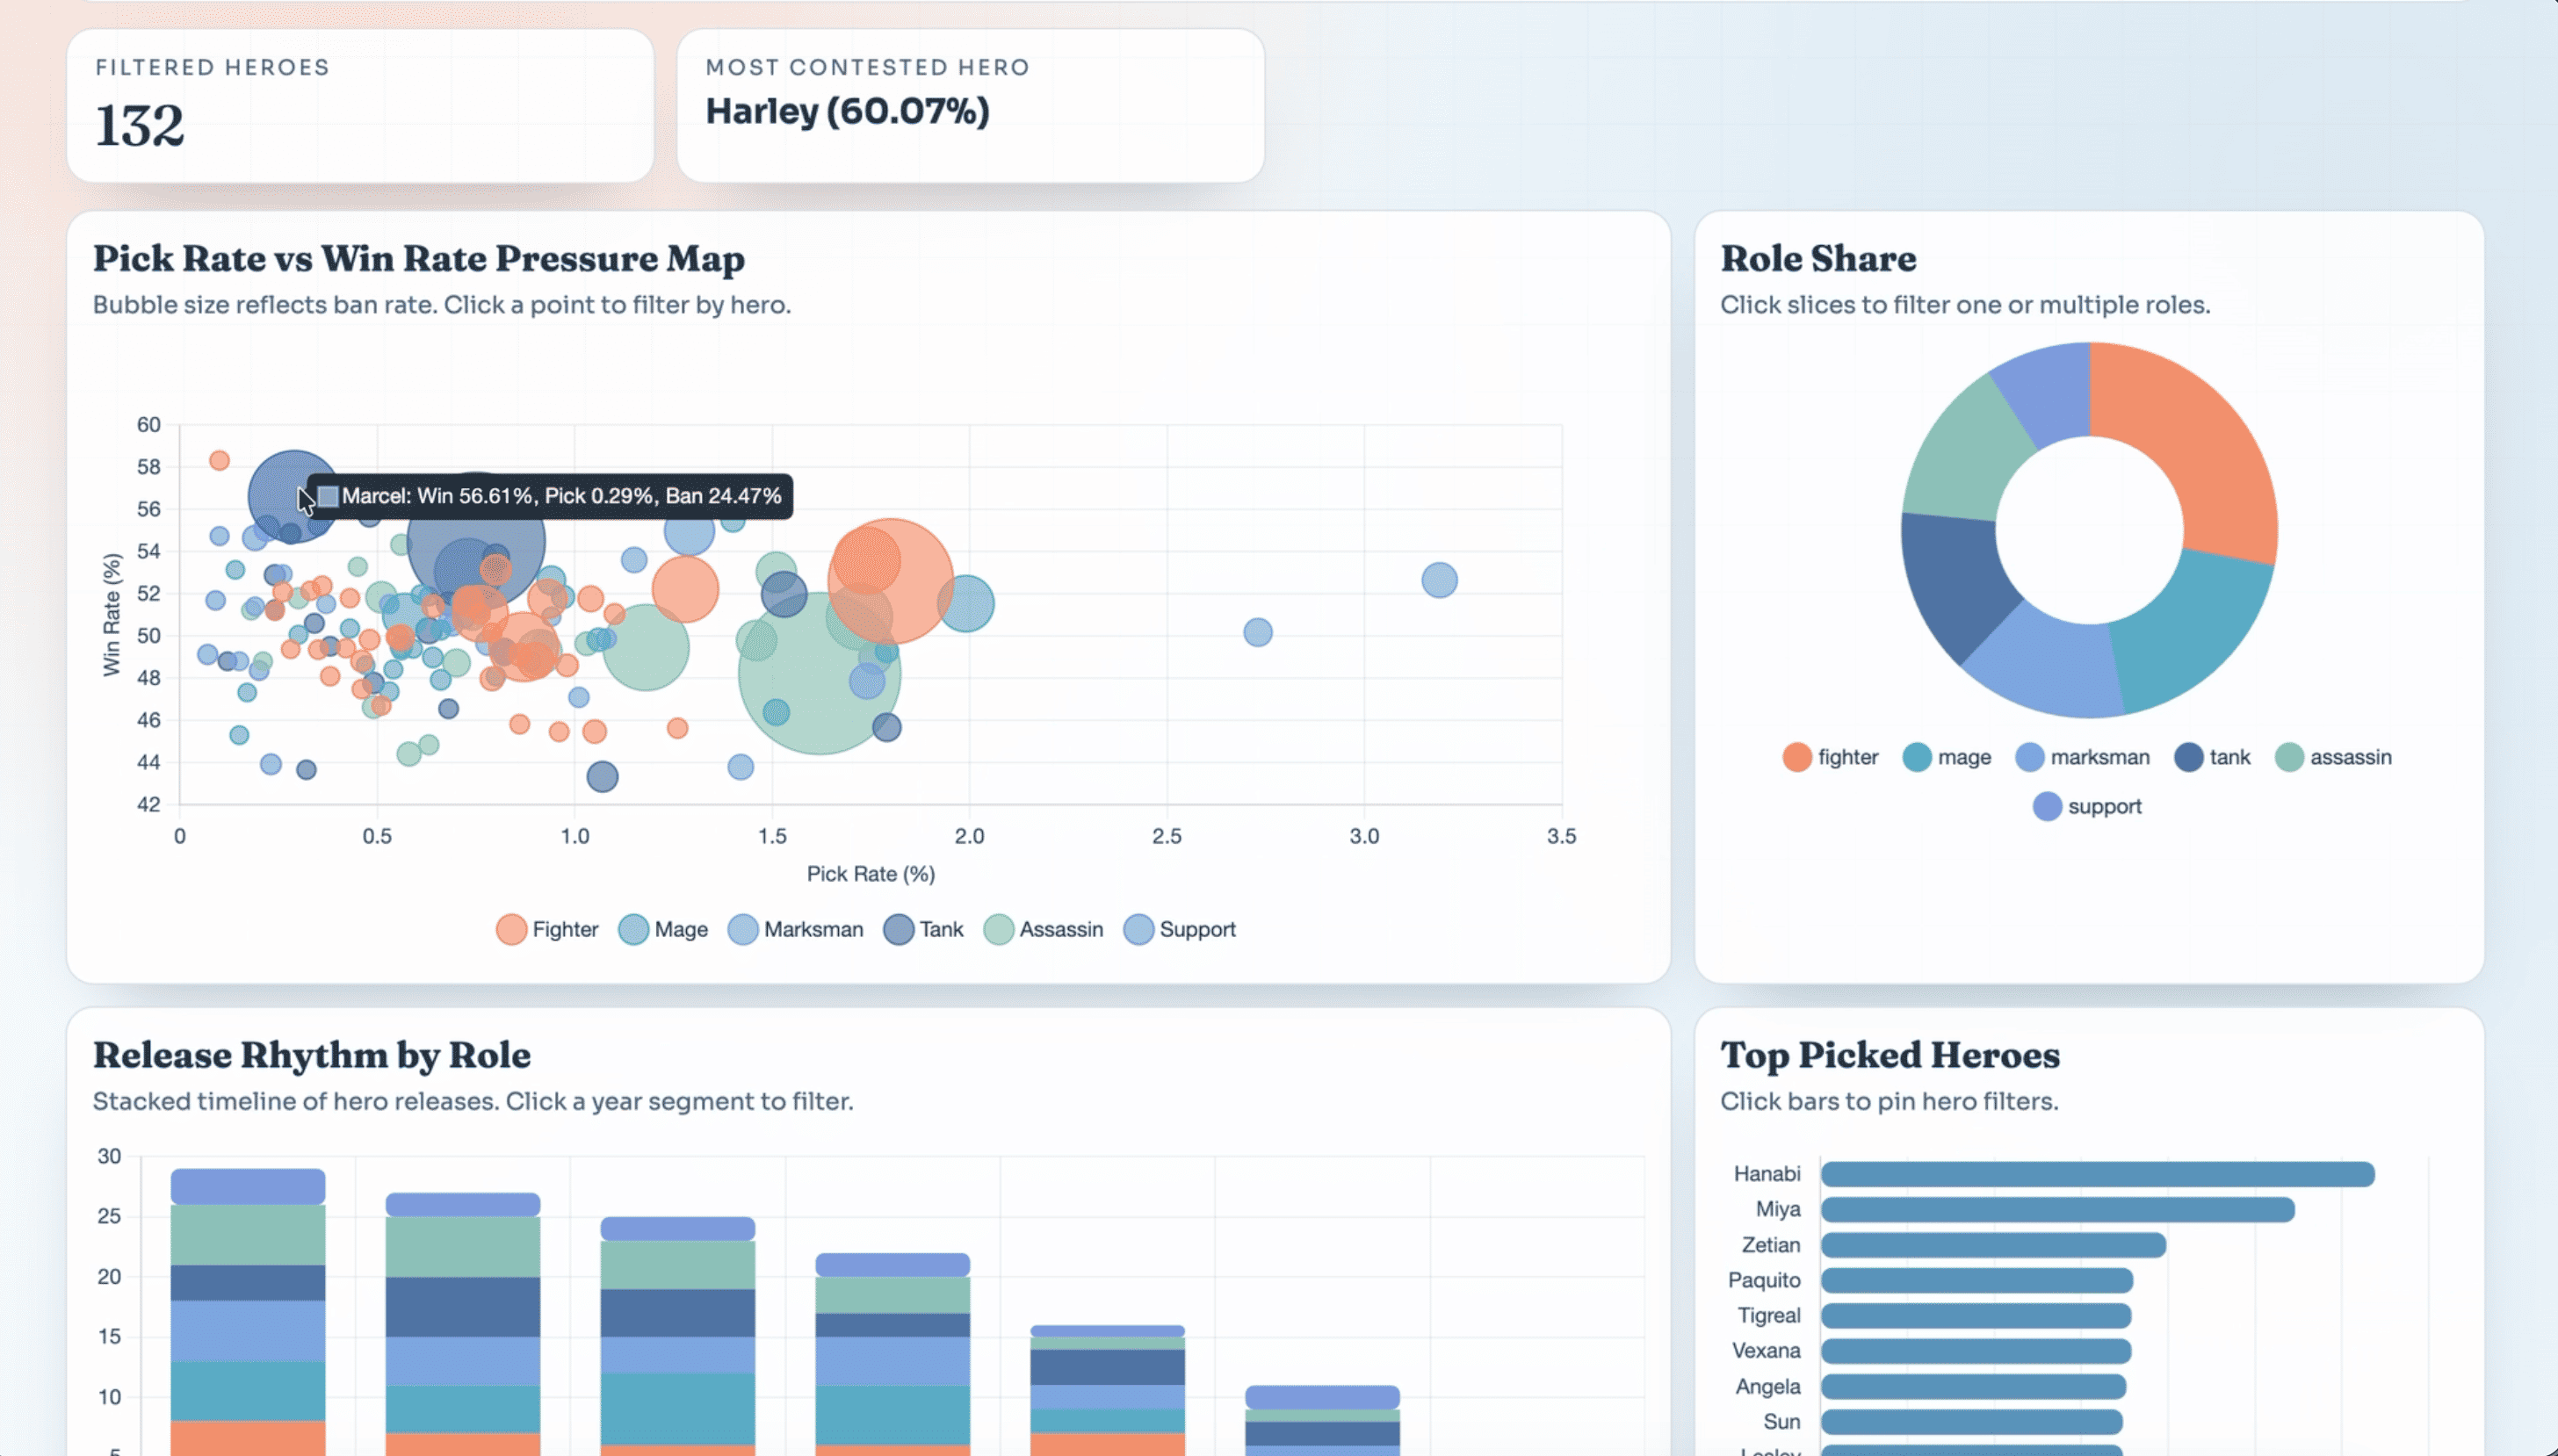
MLBB Heroes Dashboard

A simple dashboard to explore Mobile Legends heroes, stats, and trends.

data visualizationchart.jstableautech
Projects

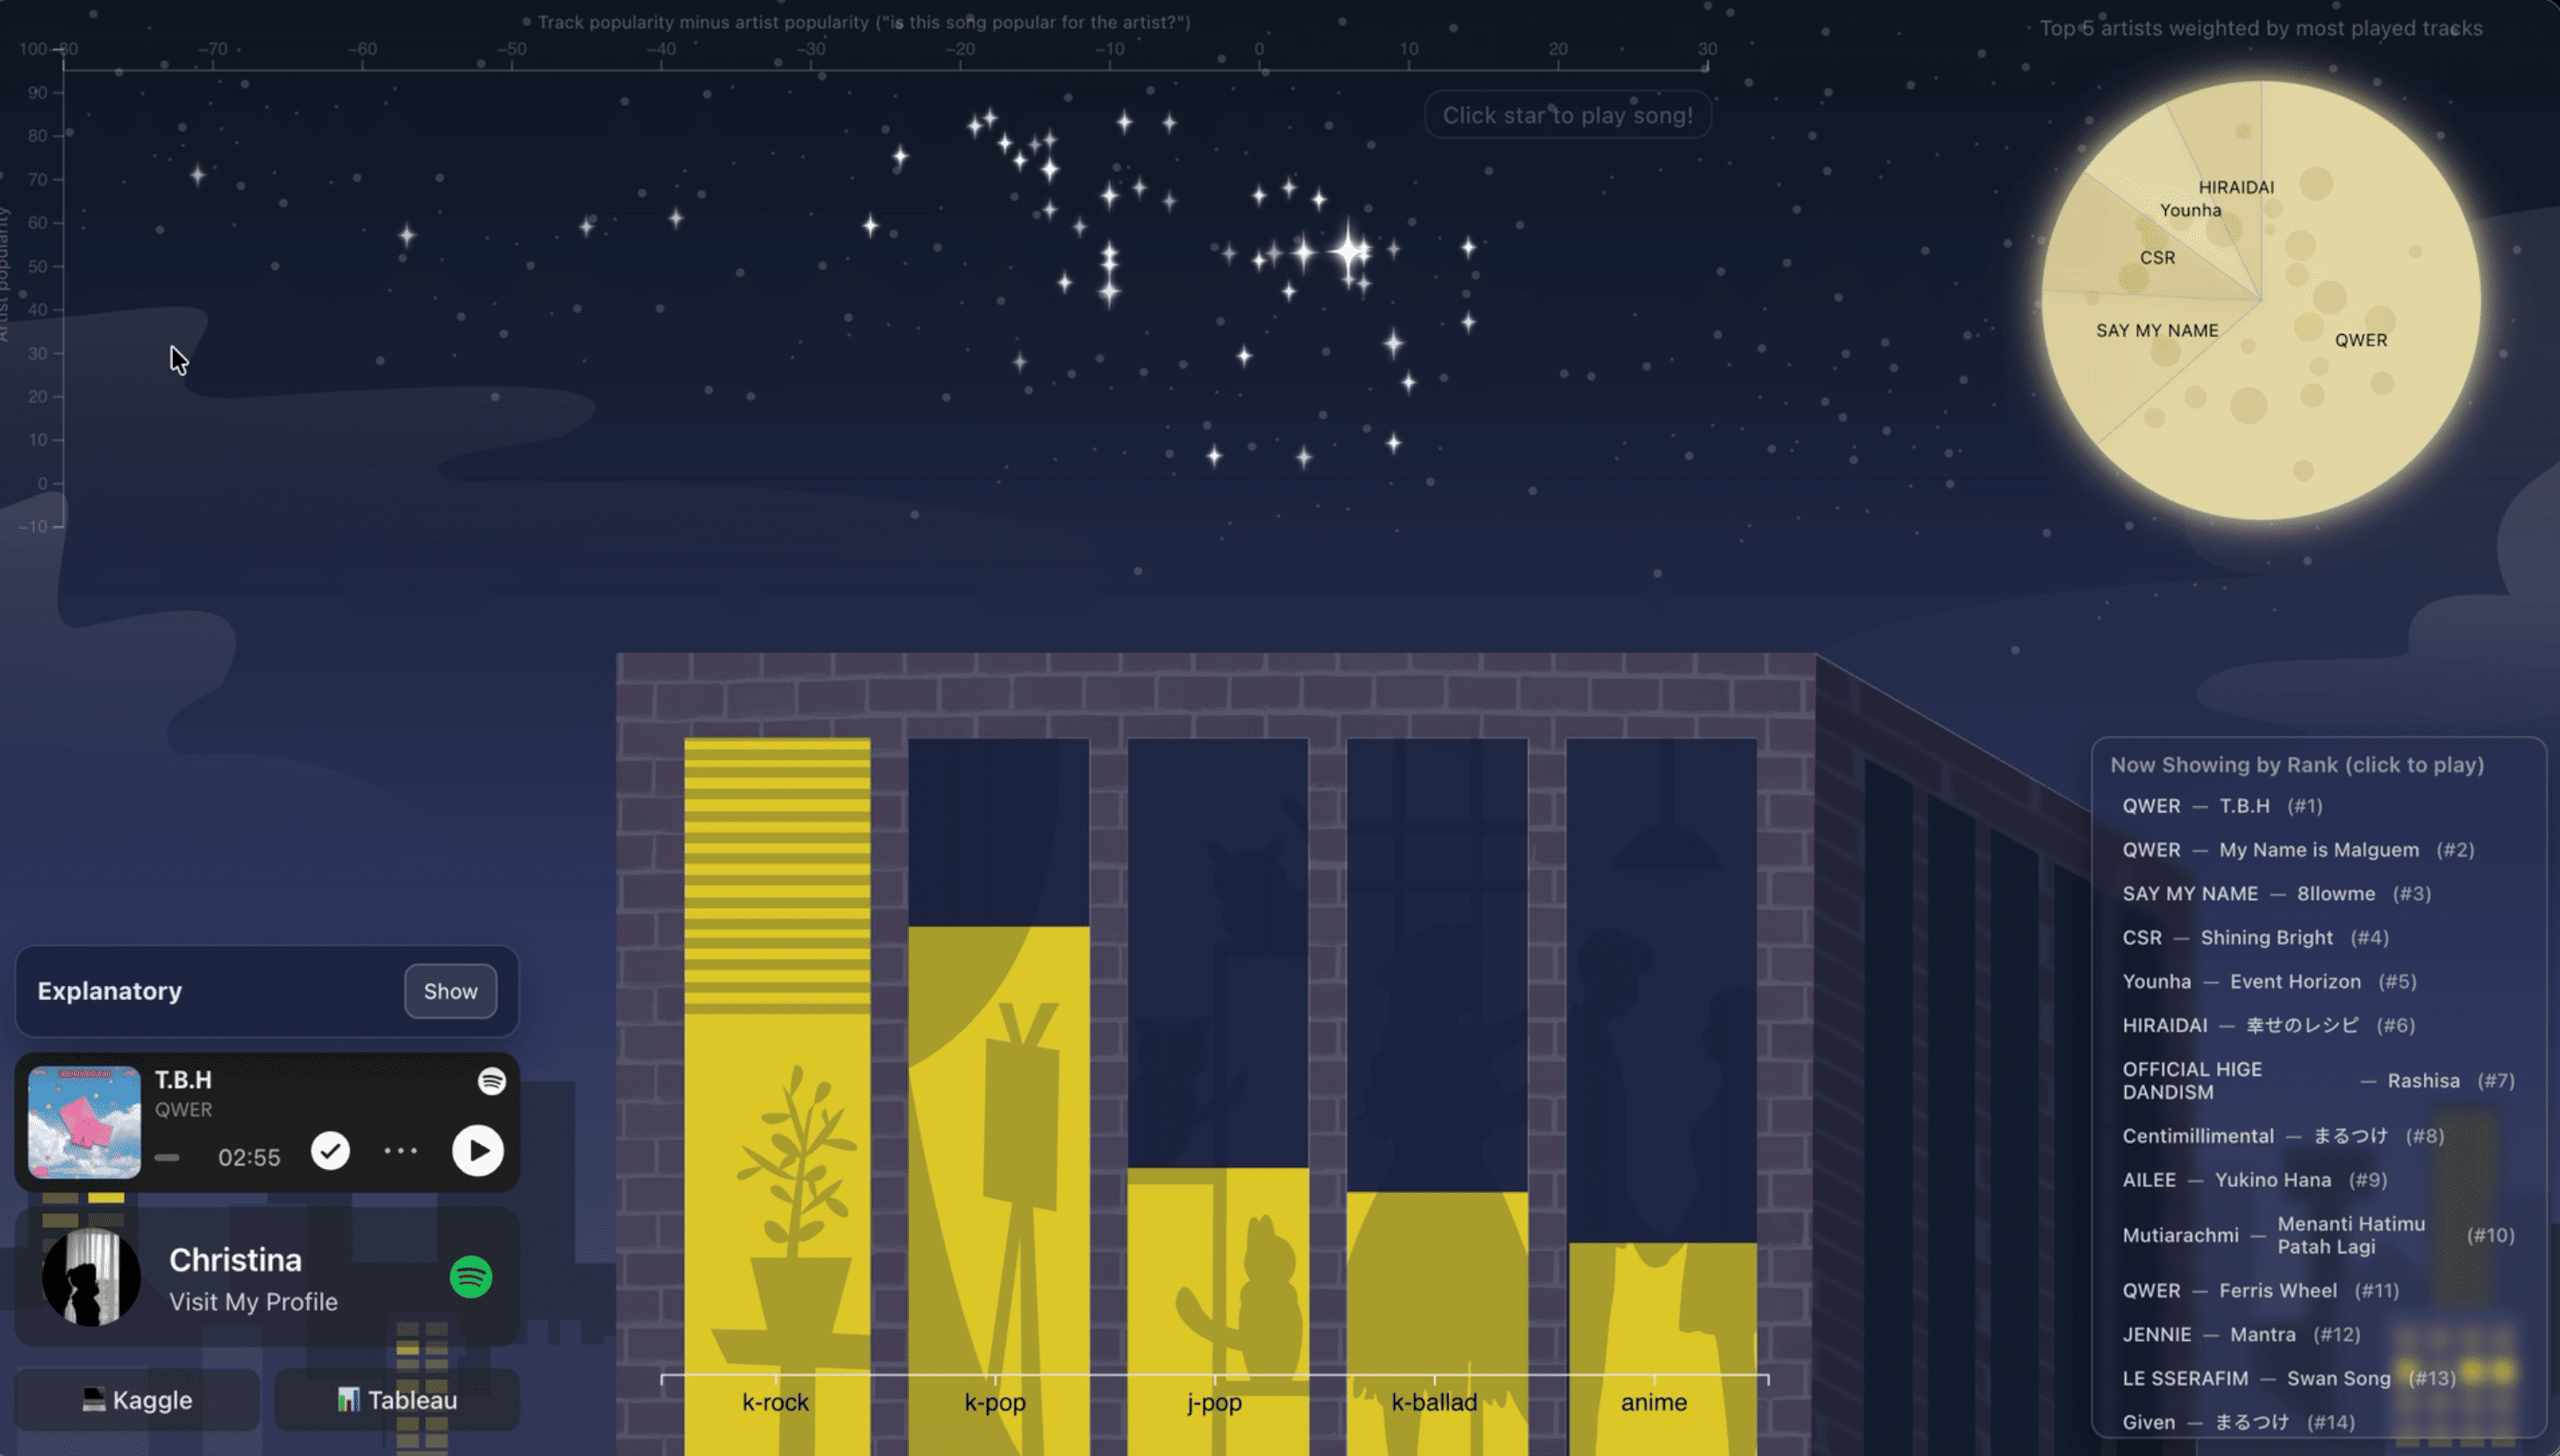
Spotify Dashboard (Night City Theme)

Turning Spotify listening data into a fun, interactive music dashboard.

data visualizationd3.jsaffinityspotify
Projects

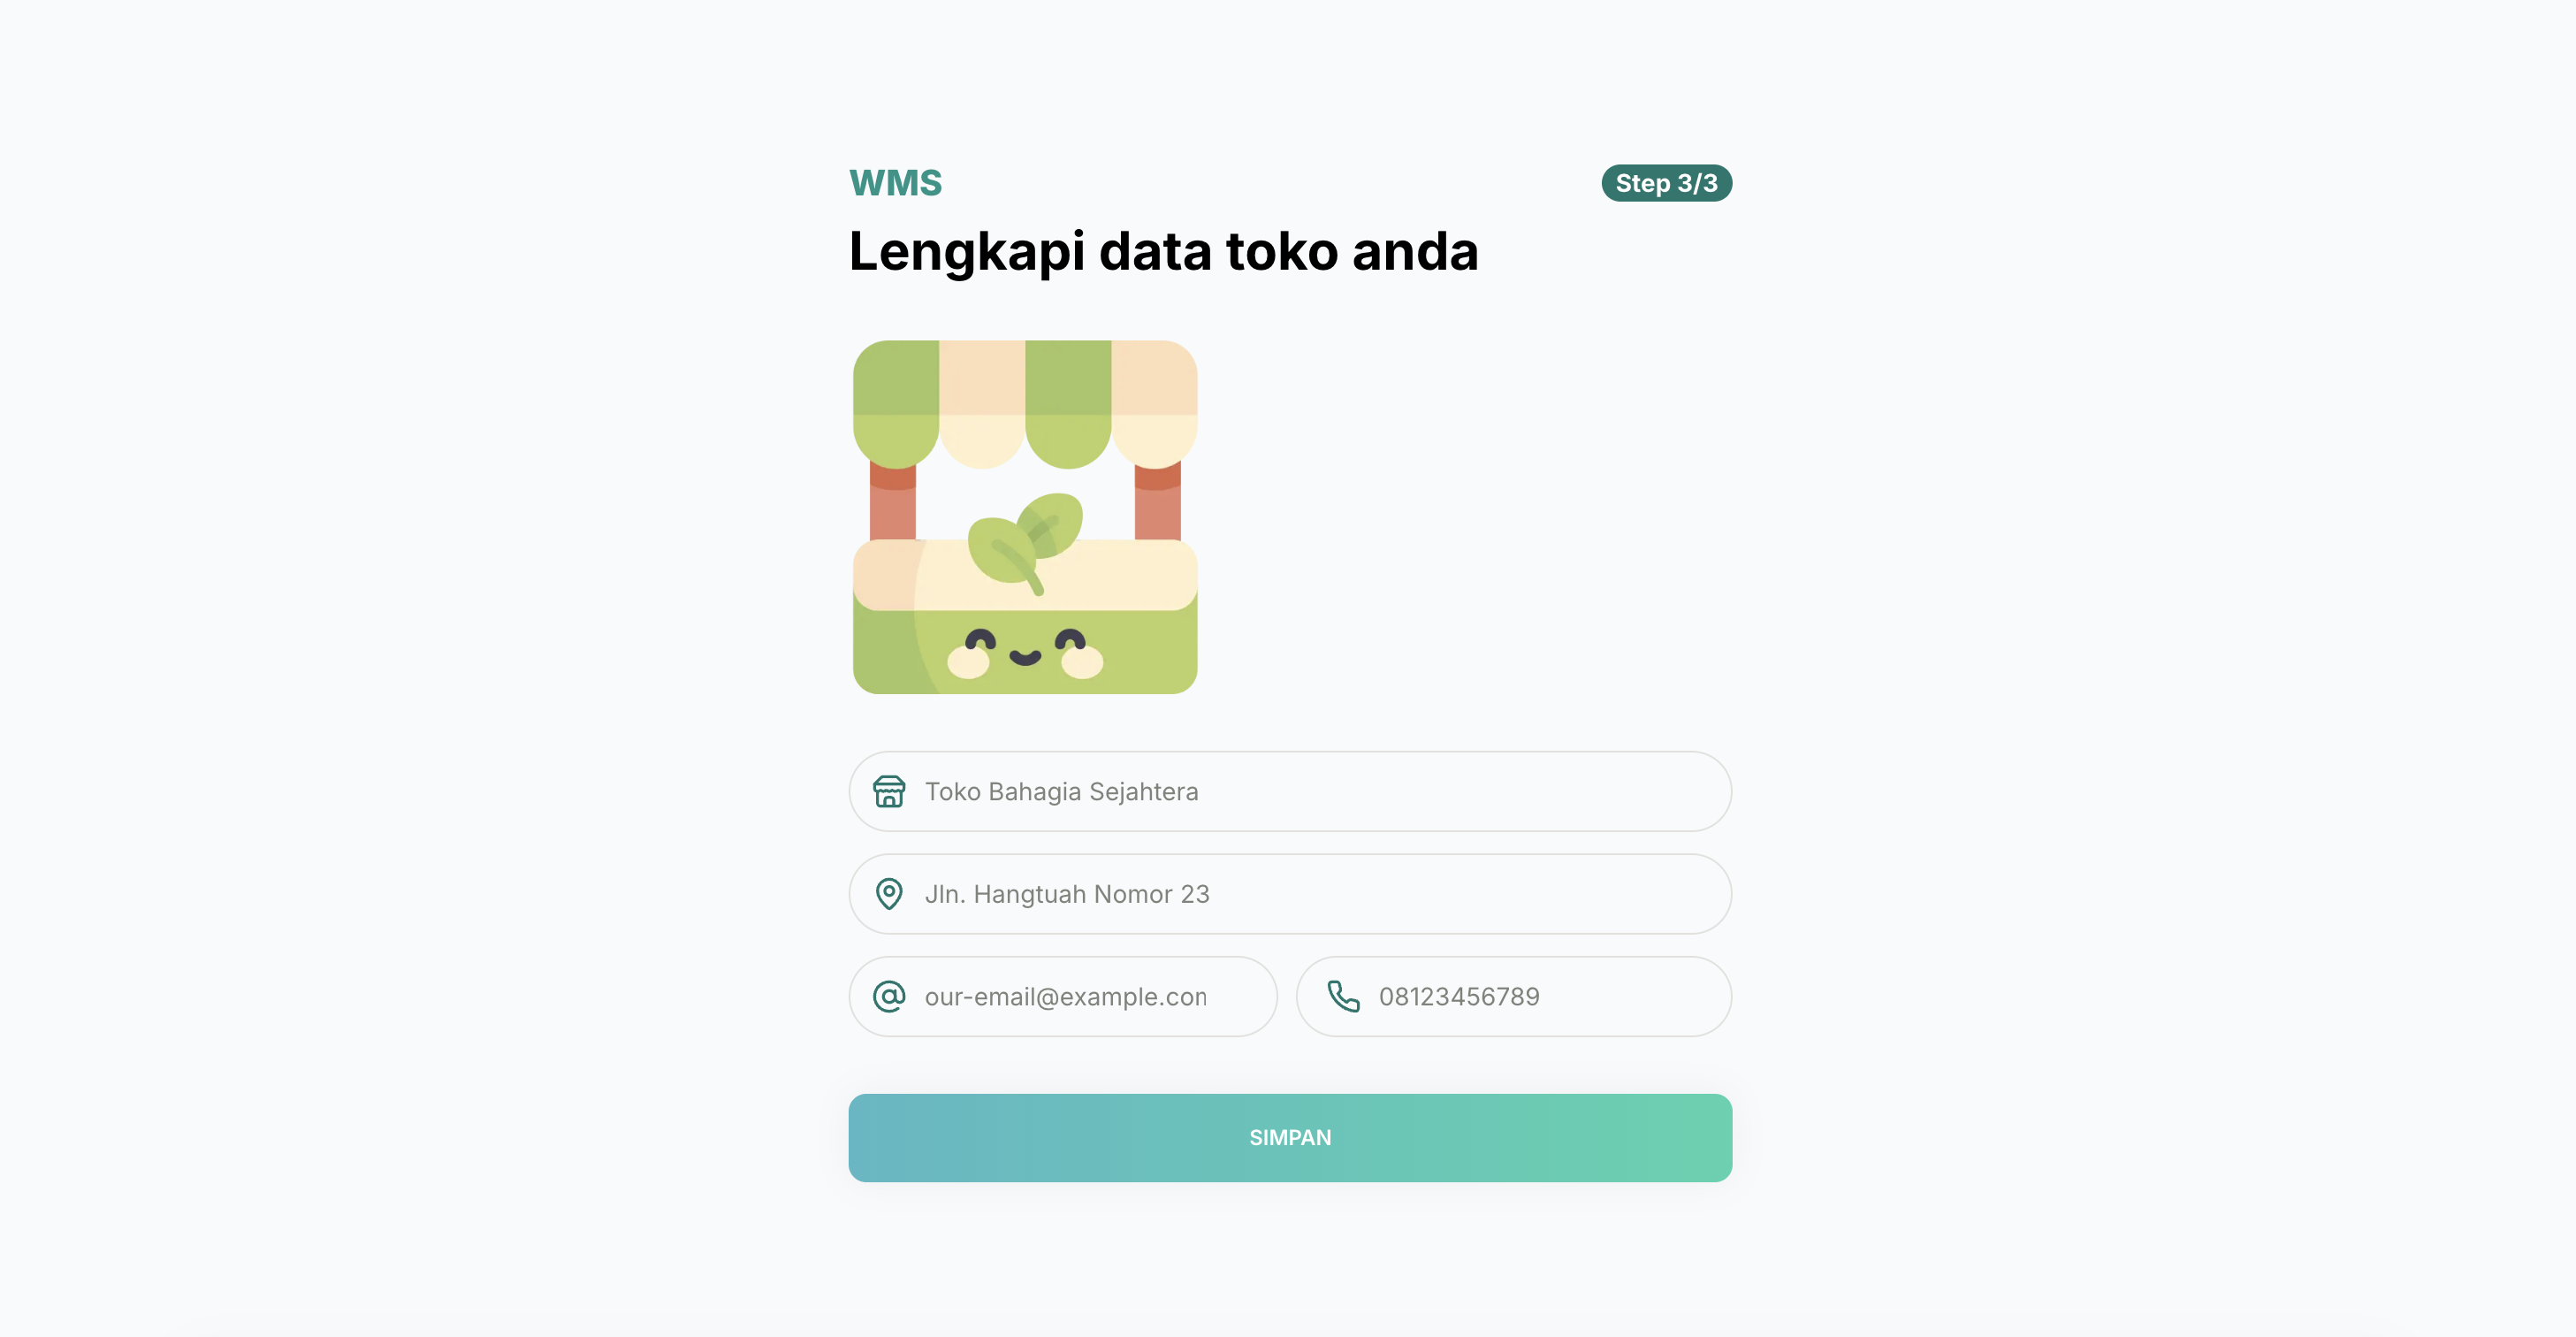
Warehouse Management System - Inventory Management for Small Businesses

A web dashboard for inventory, sales, and invoicing, connected to a custom Android companion built for one client's on-site stock-checking workflow.

webtechreactgo
Projects

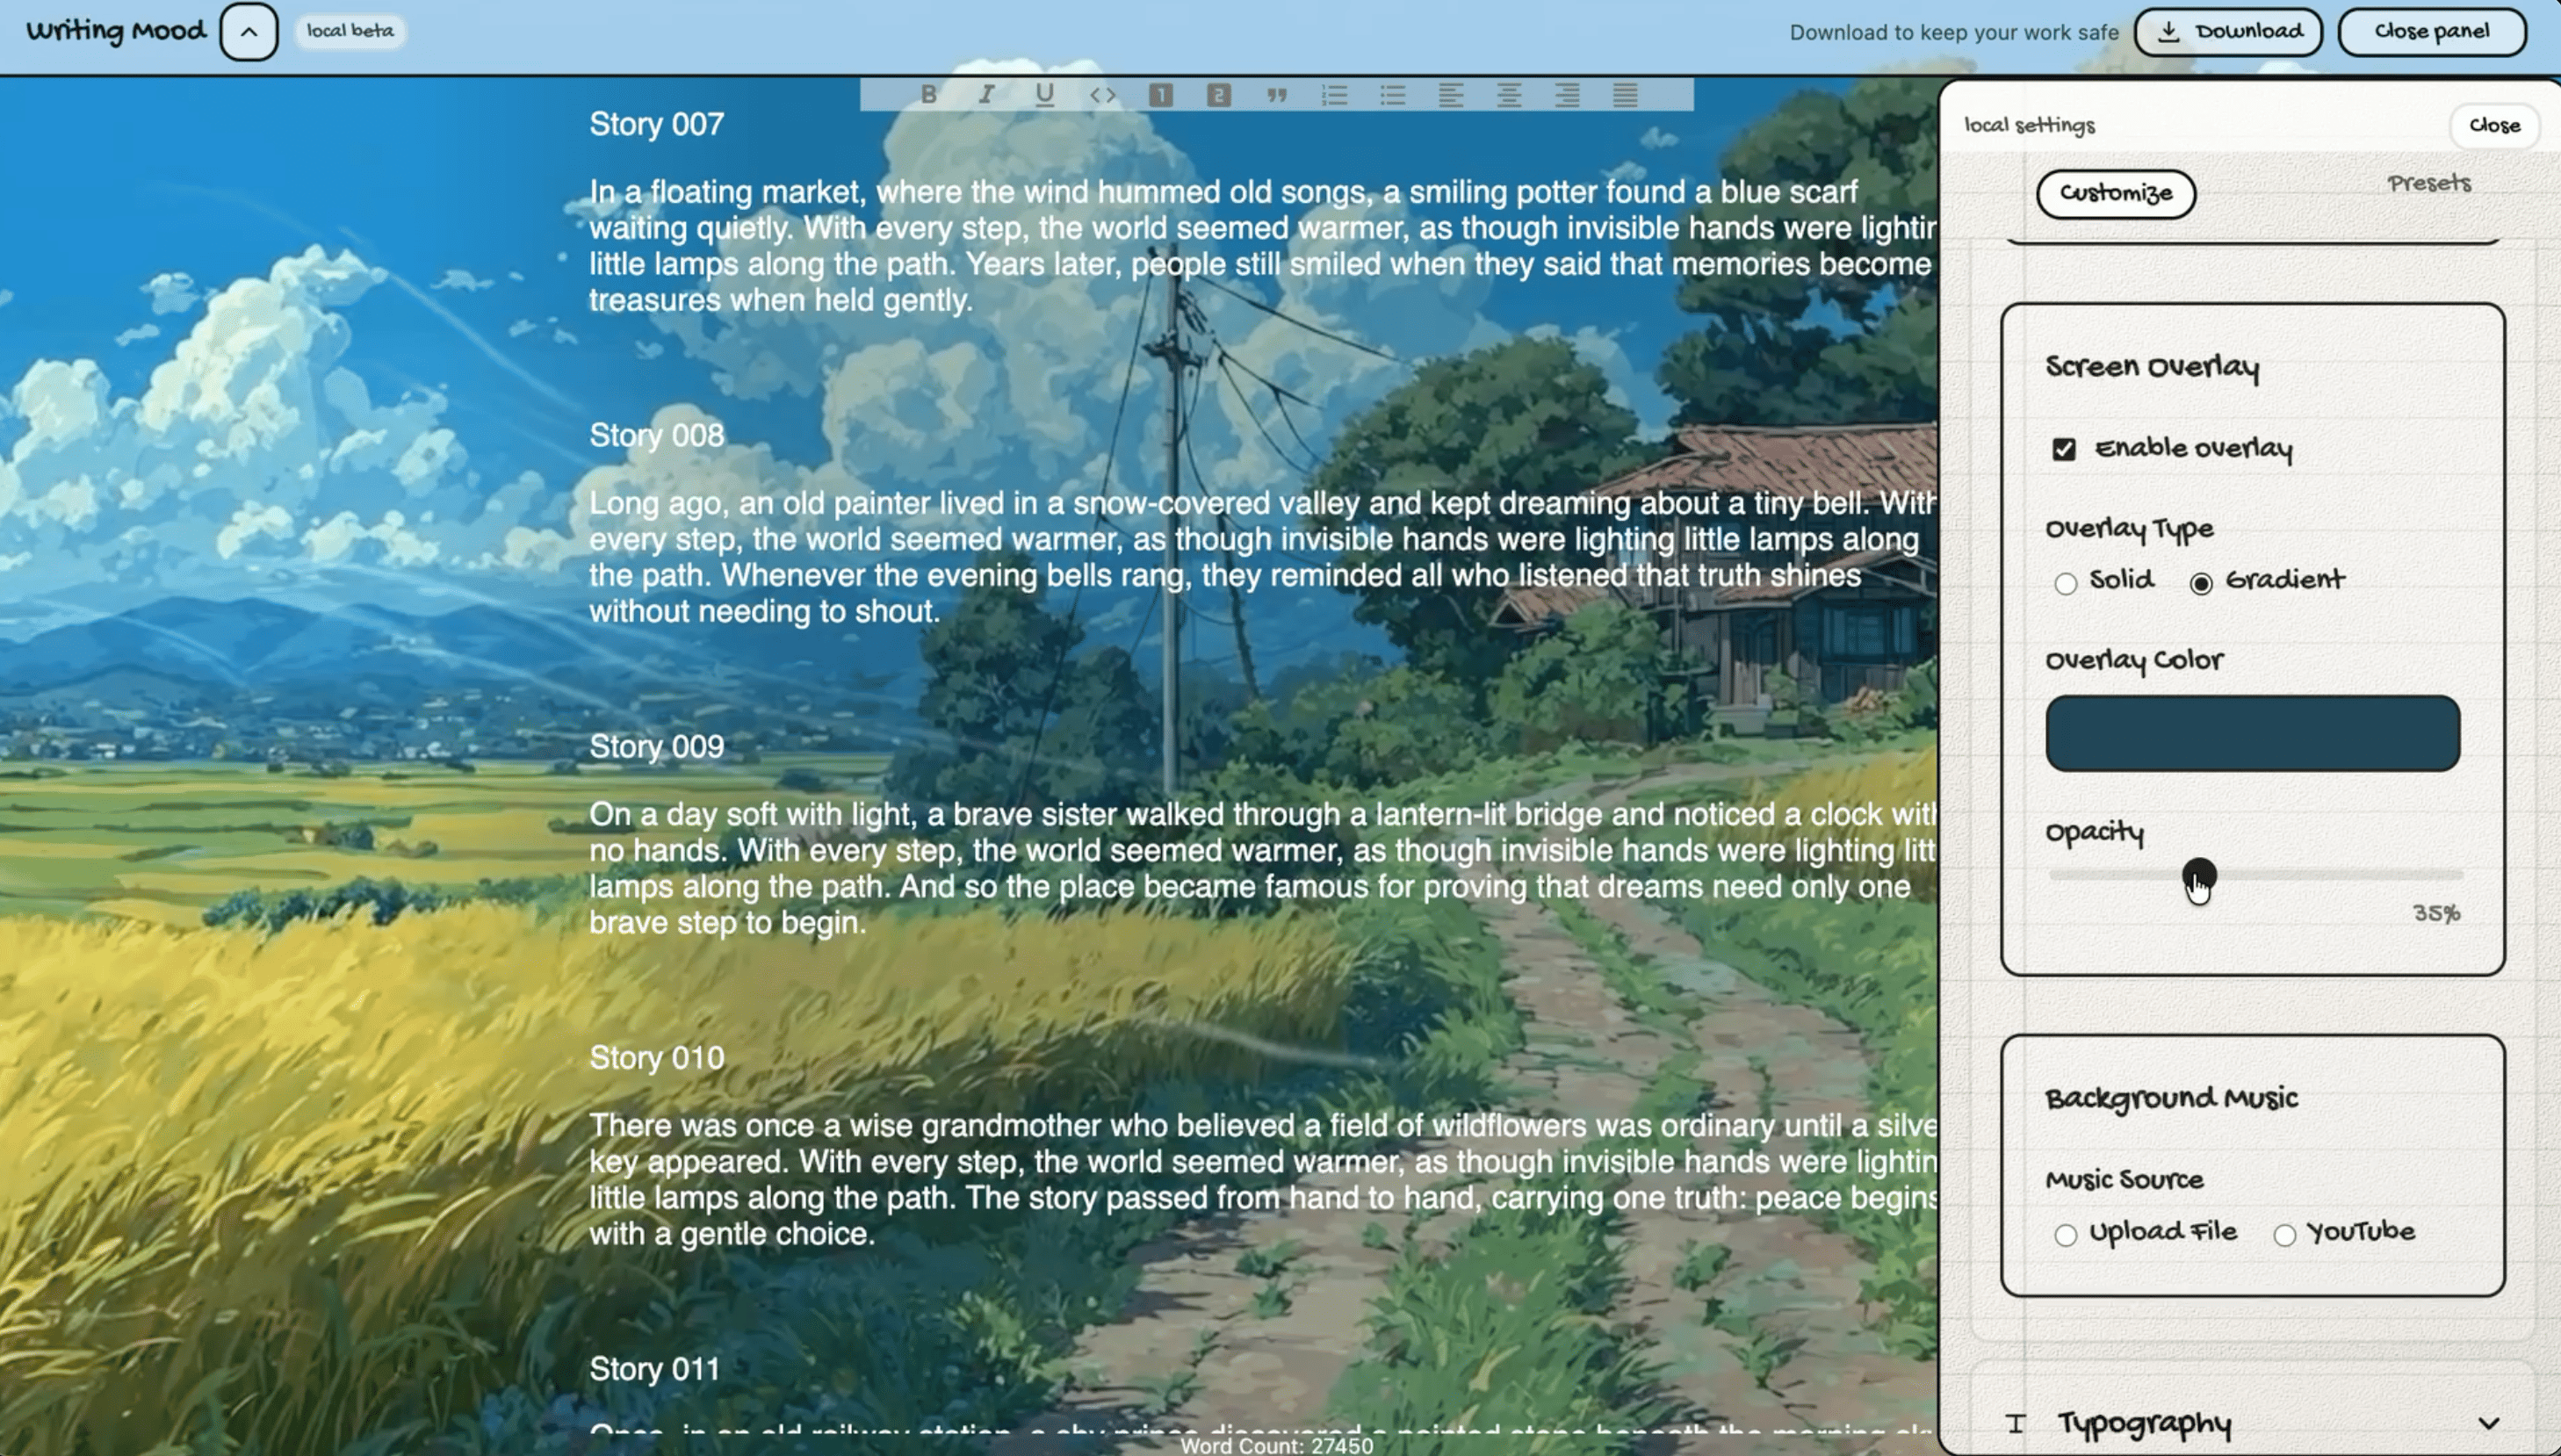
Writing Mood: Add Vibes to the Blank Page

Some days, writing feels easy. Other days, even a blank page can feel intimidating. And honestly, the usual plain white editor doesn't always help.

techwebwriting

04 / Elsewhere

I Also Do

A mix of side projects, experiments, and interests outside my usual work.

Projects

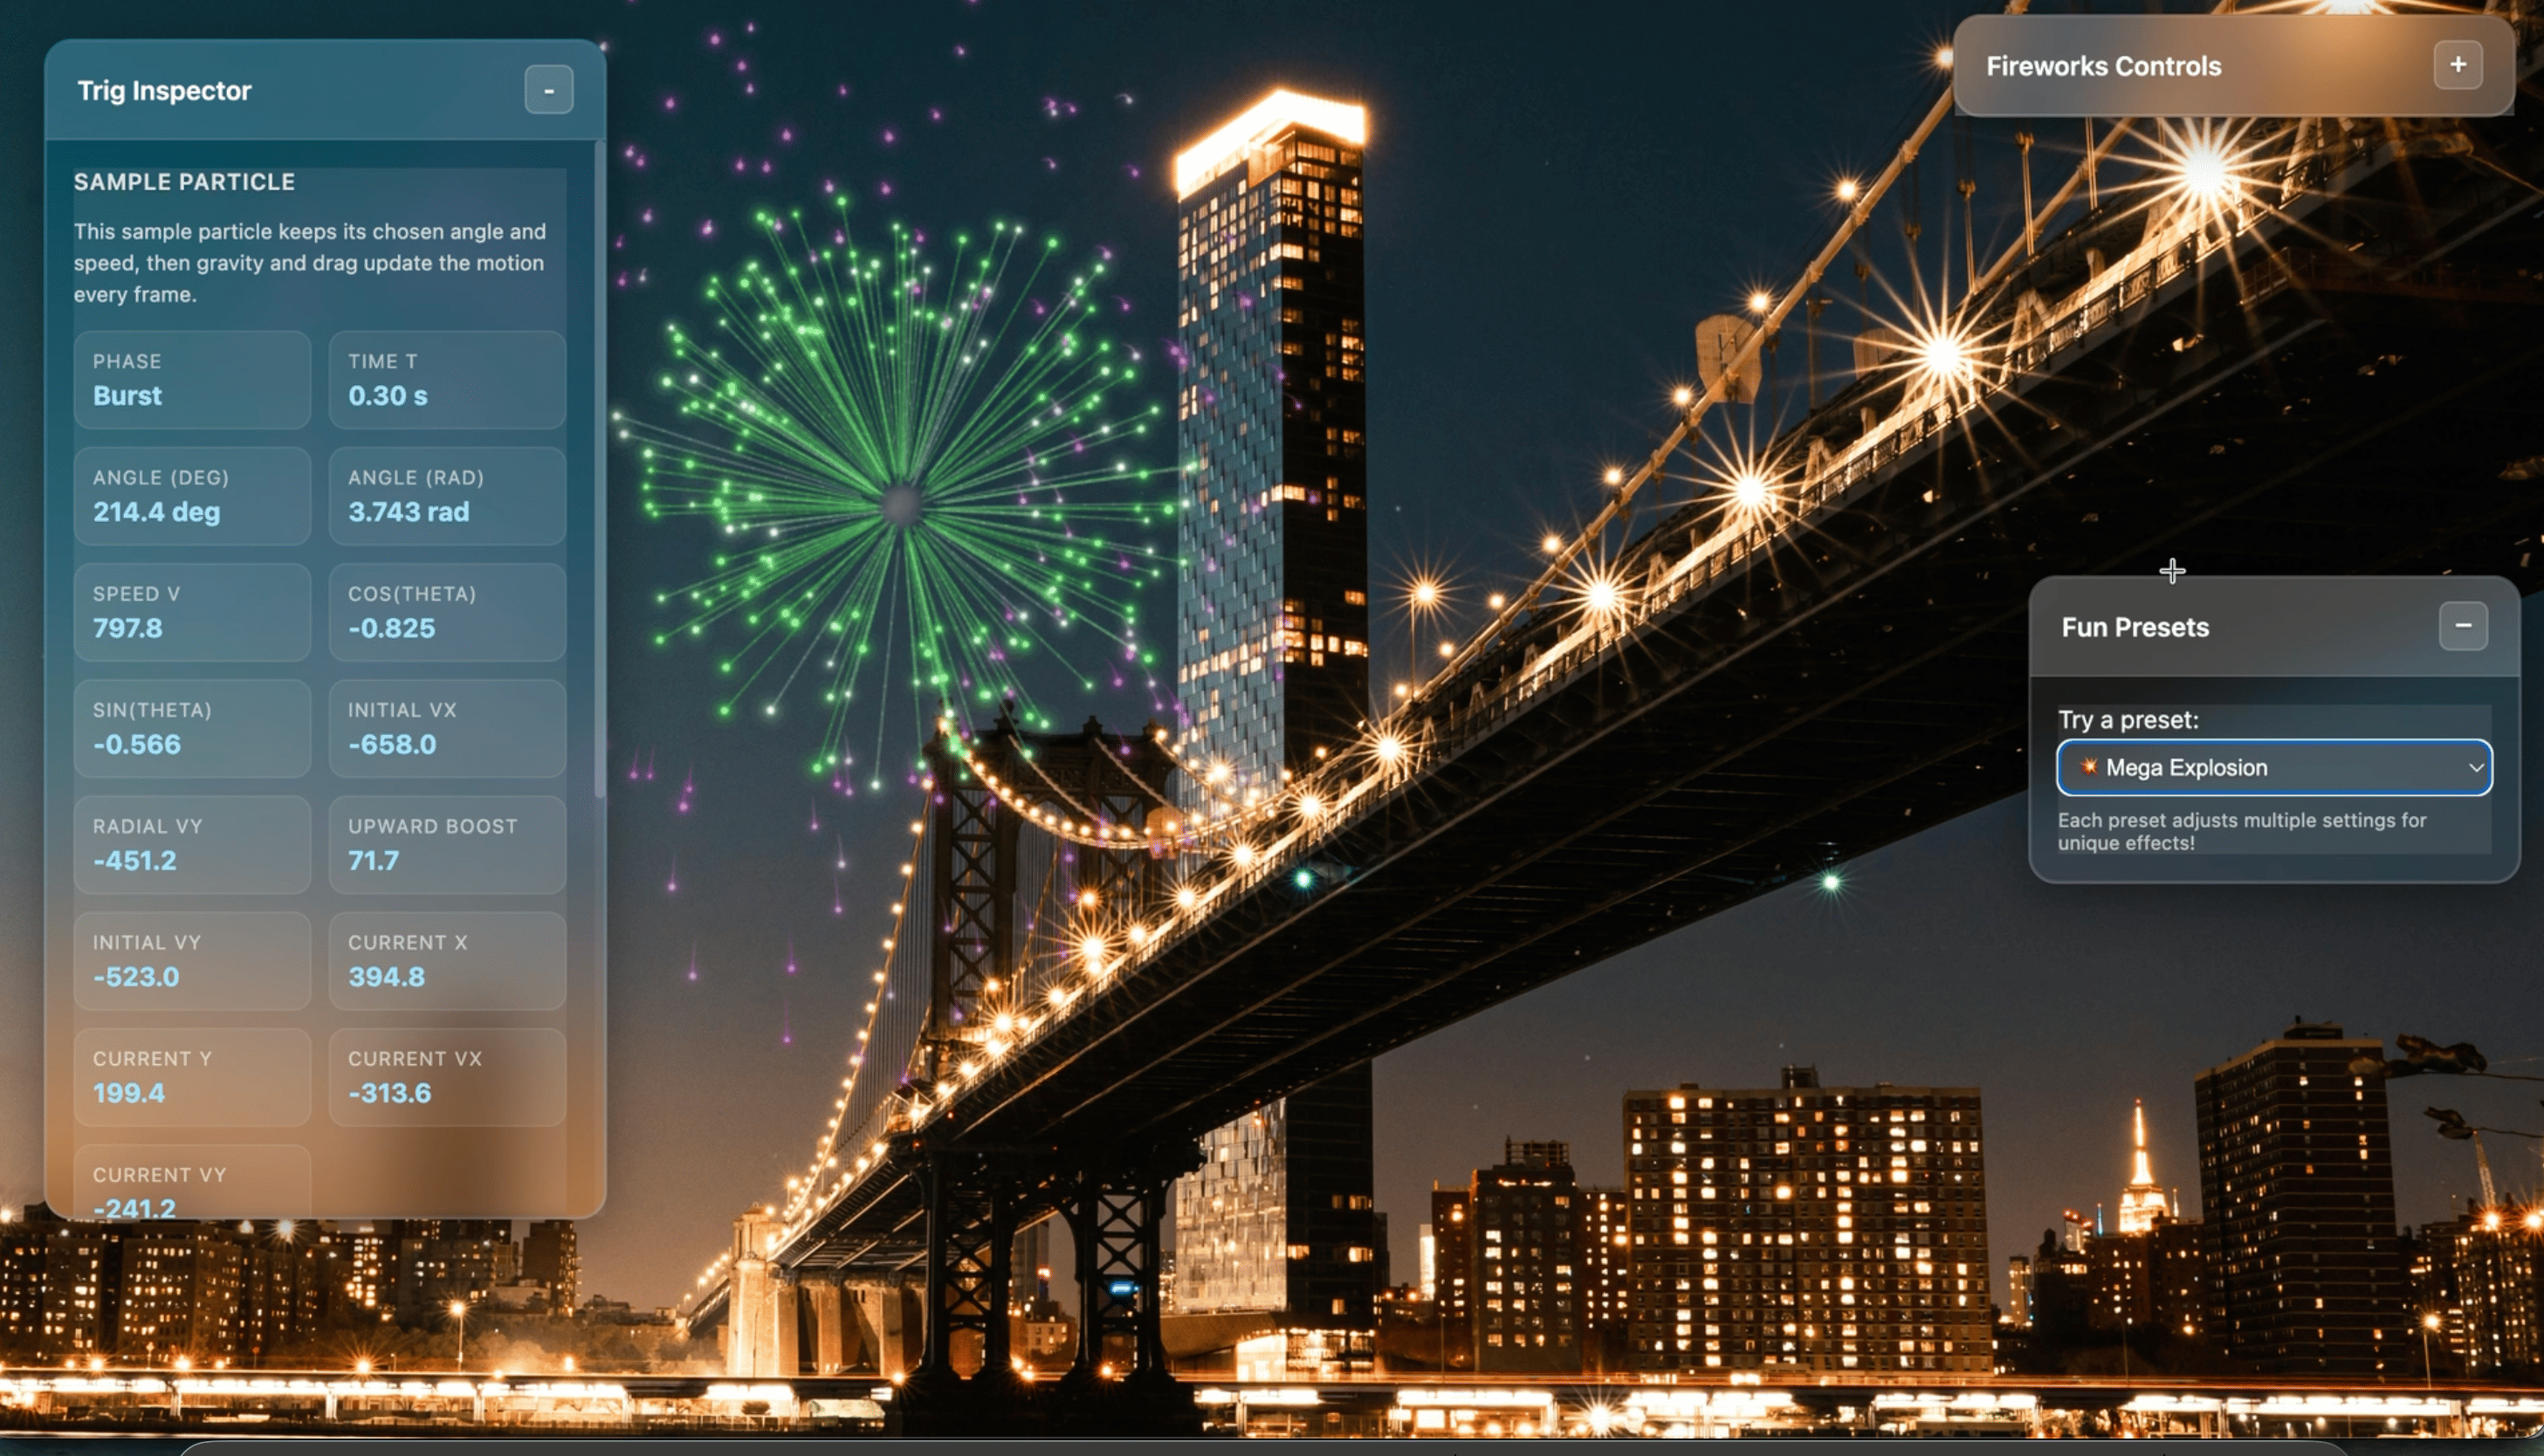
Fireworks Visualizer: Making Interactive Fireworks with p5.js

A playful way to revisit high-school math through interactive fireworks, built with JavaScript, p5.js, and a little particle physics.

d3.jsmathweb
Projects

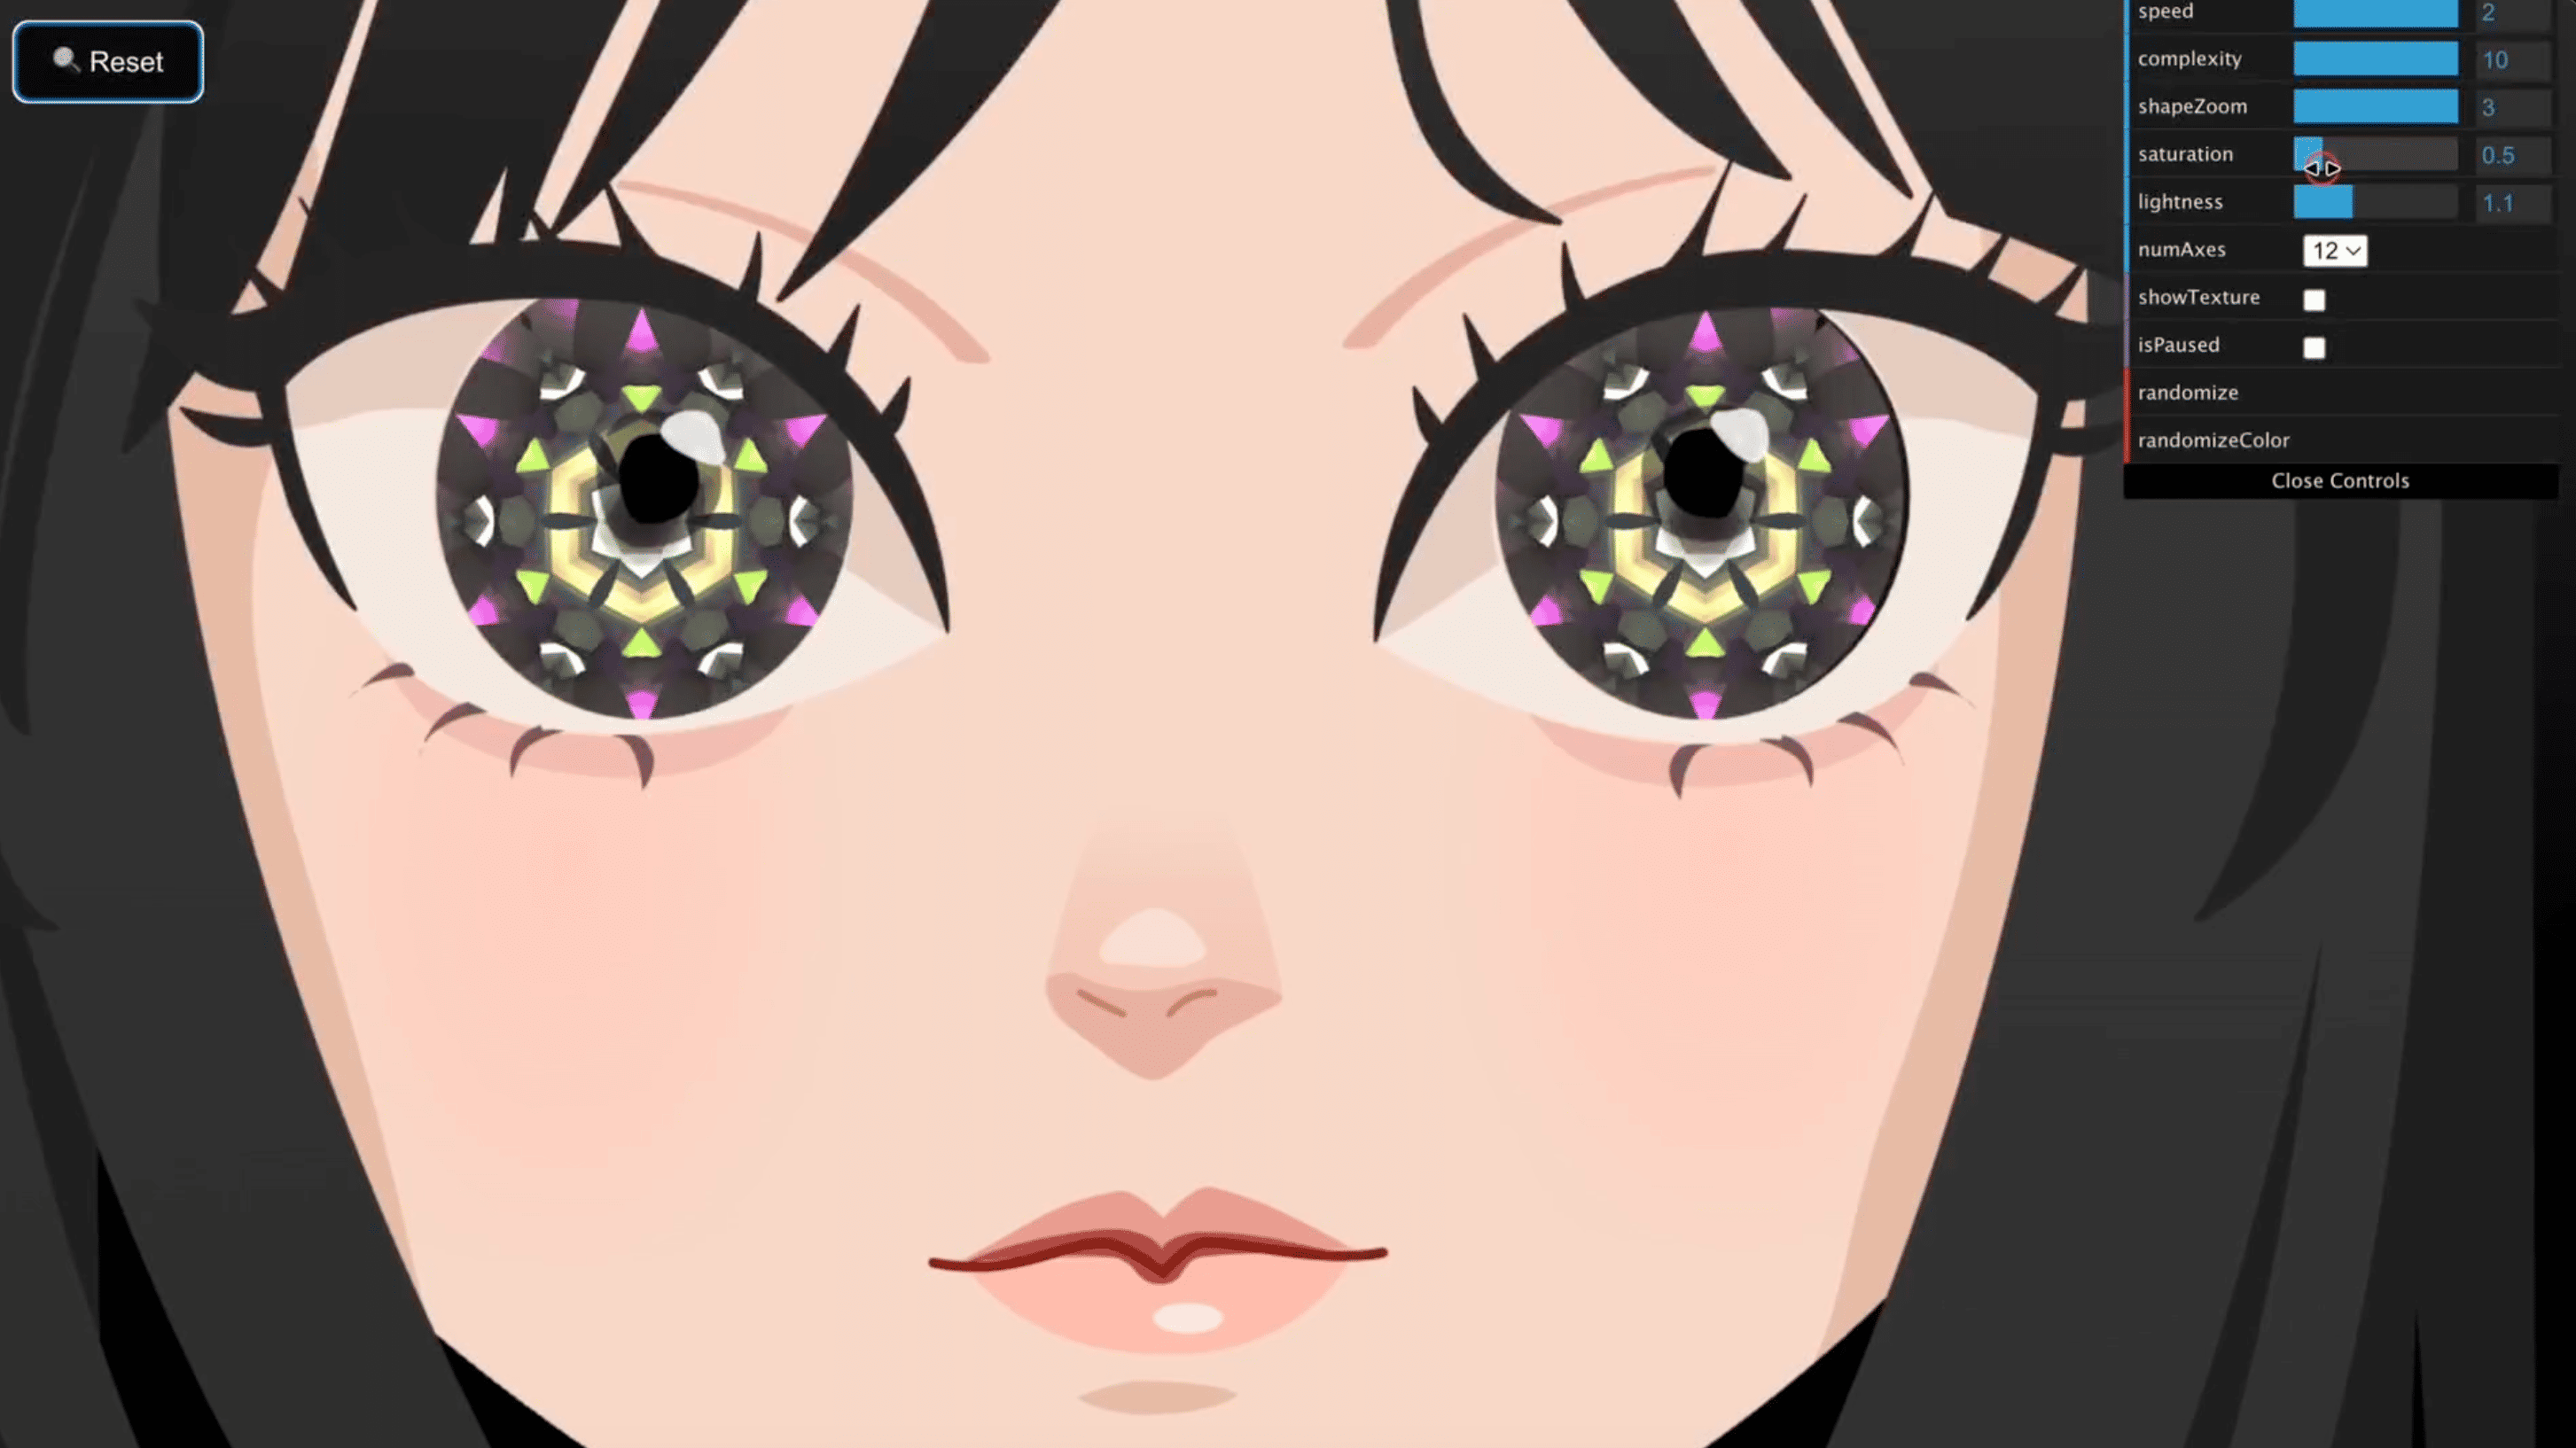
Kaleidoscope Eyes - An Interactive Rive & WebGL Experience

An original girl illustration drawn in Affinity, brought to life with Rive animation, kaleidoscope eyes, and playful browser interactions.

webglriveaffinityweb
Projects

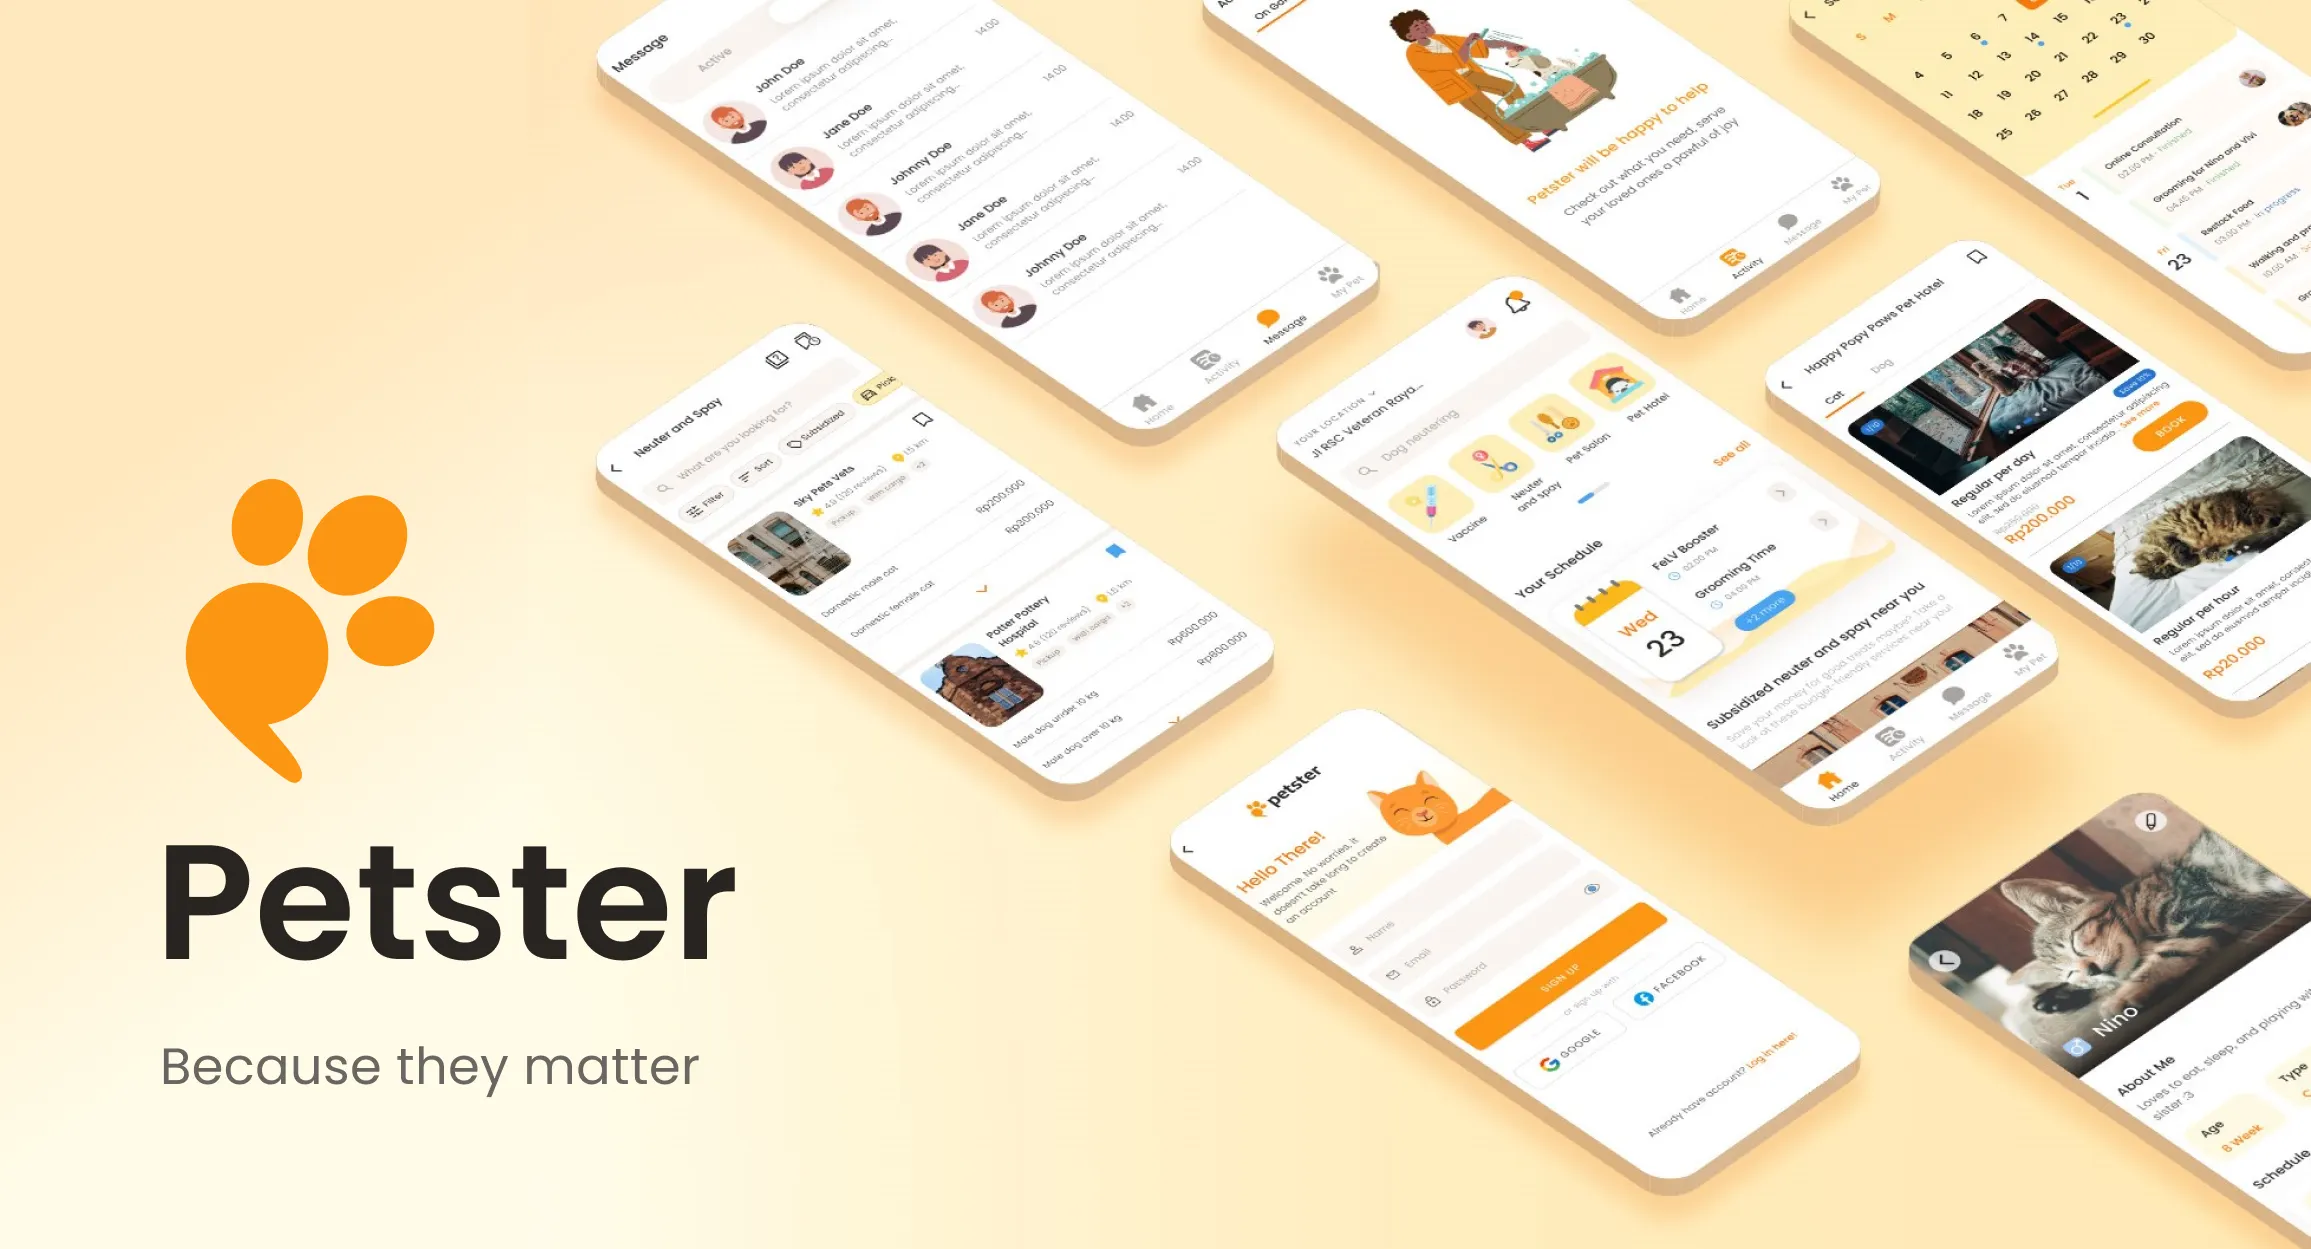
UI/UX Case Study: Petster  -  The Ultimate Pet Companion

Petster is a one-stop mobile platform that helps pet owners to connect with pet care service providers.

UI designUX researchtechapp

05 / Anonymous

Greet me in one click

Feedback, a question, or a note you would rather send without attaching your identity.

No name or email required. Maximum 2,000 characters.

Project note

A CV That Updates Itself (Hopefully)

🔎 Overview

Be honest: how lazy am I? 😂

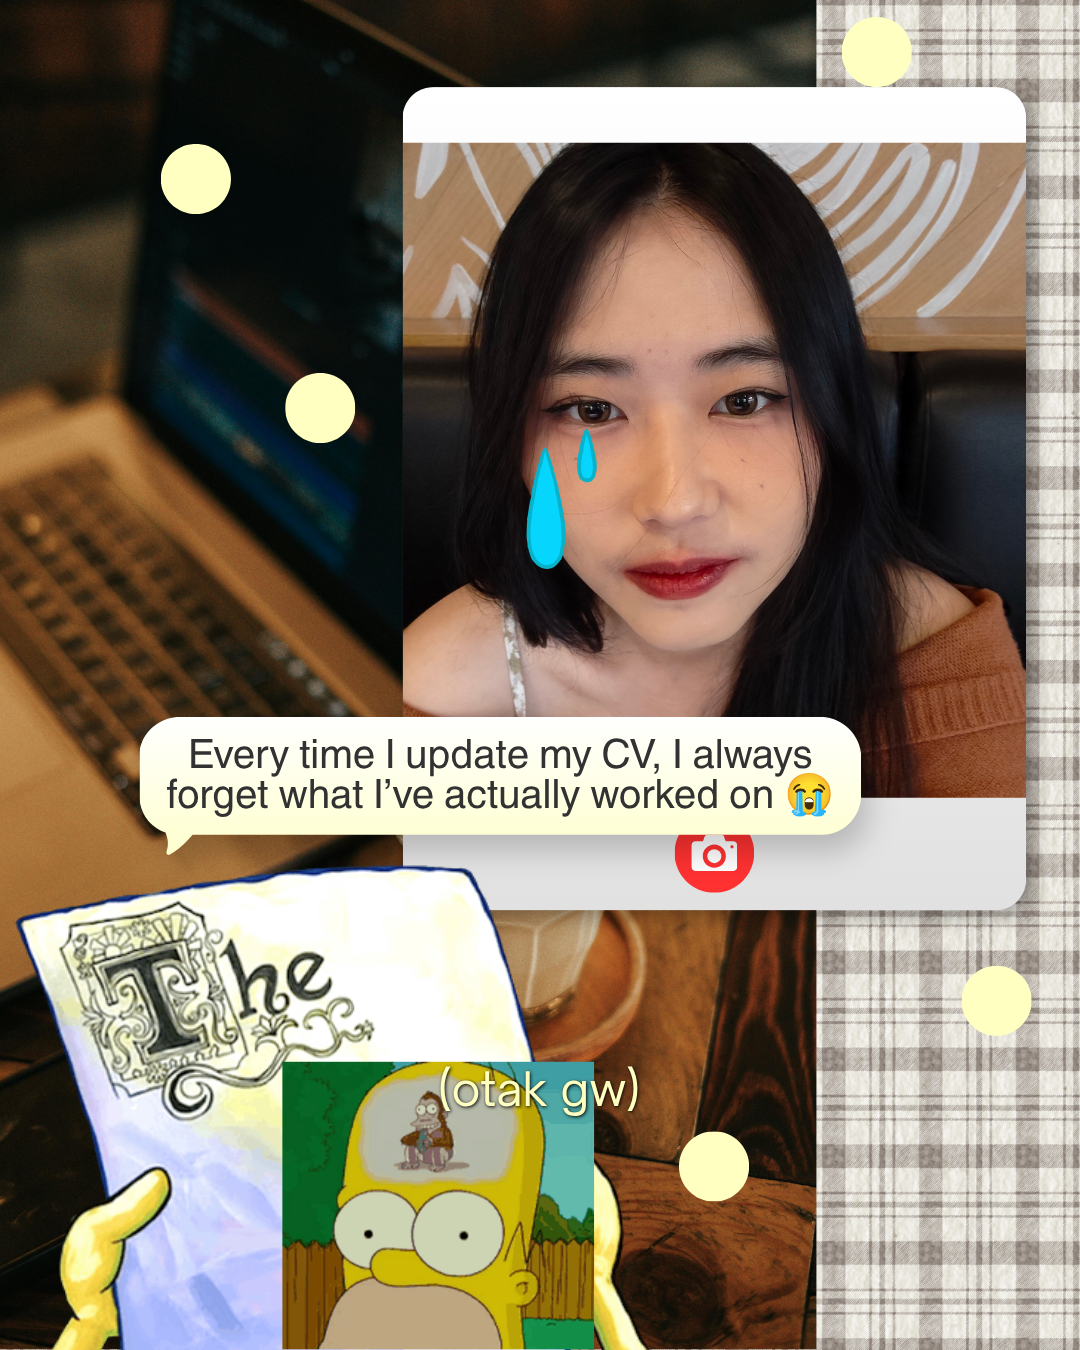
Every time I sit down to update my CV, I stare at the screen and think, “wait, what did I even do these past few months?” So instead of trying to remember harder, I built a little system that remembers for me.

Cover slide of the carousel: “how lazy am I?” Meet the CV that updates itself

The idea: I jot down a few sentences whenever I finish something. Once a month, a bot reads those notes, drafts a CV update, and opens a pull request. I review it, approve it, and the latest CV shows up on my portfolio website. That’s it :3

😭 The Problem

My brain, every single CV update:

Slide: “I always forget what I’ve worked on whenever I update my CV” with a meme

The fix isn’t a better memory. It’s making the noting down part so small that I can’t skip it.

📒 Step 1: A Tiny Career Journal

Whenever I finish something, I add a few lines to a private Google Sheet. No fancy format, just enough to jog my memory later.

Screenshot of the private CV_Journal Google Sheet with Date, Category, CV Target, Activity, Details and Evidence URL columns

Column What it’s for
Date When it happened.
Category Work, Side Project, Learning, Certification, Content, or Campaign.
CV Target Which CV it belongs to: Software Engineering, Creative Tech, or Both.
Activity / Details A sentence or two in plain language.
Evidence URL A link to prove it, so I don’t inflate things later.
Public Safe A checkbox. Only rows I tick are ever allowed to leave the sheet.

Since the sheet is private, I can dump everything in there. The Public Safe checkbox is my safety net: unchecked rows never get read by the bot, so nothing sensitive can leak into a public repo by accident.

🤖 Step 2: A Monthly Bot

Once a month, a GitHub Action wakes up on its own and does the boring work for me.

Screenshot of the cv-review GitHub Actions workflow next to the resume folder in the repo

Here’s the whole flow:

Flow diagram: Spreadsheet, Git repositories and latest CV feed a GitHub Action, which uses an agent to draft updates, writes a new YAML CV and renders it to a PDF

  1. Collect: the Action reads the journal rows I marked Public Safe, and sees what’s already in my current CV file (YAML).
  2. Draft: a small script proposes updates to the CV file. There’s an optional AI helper that can polish the wording of rows I specifically allow, but it’s off by default and the script falls back to my original text if it isn’t available.
  3. Render: the updated YAML gets turned into a PDF.
  4. Propose: instead of changing anything directly, the bot opens a draft pull request.

🎨 Step 3: RenderCV Does the Layout

I really don’t want to fiddle with margins, columns, and fonts every time. RenderCV is a free, open-source tool that takes a YAML file and turns it into a clean, ATS-friendly PDF.

Slide showing a YAML CV file next to the rendered PDF, with a RenderCV GitHub repository page below

So my CV is basically just content in a YAML file. I can edit the words and adjust the design from the same place, and the layout is handled for me. I keep two tracks, one for Software Engineering and one for Creative Tech, and each is rendered separately.

🏠 Step 4: Living Next to My Portfolio

The CV files live in the same repository as my portfolio website. The scripts, the workflow, the CV YAML files and the site all sit side by side, which means one merge updates everything.

Screenshot of the personal-blog repo in an editor: the resume and scripts folders, plus a successful CV - Monthly Review run in GitHub Actions

🫶 Step 5: I Review, Then Approve

Nothing goes live on its own. Every change from the bot arrives as a draft pull request, so all I have to do is read it, fix anything that sounds off, and approve it. (I’m still the one who decides what’s true about my own career!)

Screenshot of a GitHub pull request titled “chore(cv): monthly CV proposal” opened by github-actions

Once I merge, the website redeploys and the newest PDF is ready to download straight from my portfolio:

Screenshot of the portfolio homepage with Download Software Engineering CV and Download Creative Tech CV buttons

🔁 The Whole Loop

  1. Note it: I write a few sentences in the sheet whenever I finish something.
  2. Collect: once a month, GitHub Actions reads the Public Safe rows.
  3. Draft: a script proposes updates to the CV YAML.
  4. Render: RenderCV generates the PDF for each CV track.
  5. Review: the bot opens a draft pull request and I check every line.
  6. Publish: after I merge, the portfolio serves the latest CV.

📏 A Few Honest Notes

  • It only reads the sheet for now. The diagram also shows my Git contributions as an input, but that’s the next thing I want to add, not something that’s running yet.
  • The AI is a helper, not the author. It’s optional, it only touches rows I explicitly allow, and I read every line before approving.
  • I still check everything. The bot can propose, but only I can merge.
  • Not everything is fixed yet. My portfolio originally had a single download button, and I haven’t tidied up that section since adding the second CV 😭

💭 Why I Built It

I don’t need another thing that reminds me to update my CV. I need the update to mostly happen by itself, with me only doing the part that matters: making sure it’s accurate.

Will it actually work, or will it end up as a forgotten project?! IDK, let’s see 😭

Project note

Hermes × WhatsApp: My Brain-Dump Executor

🔎 Overview

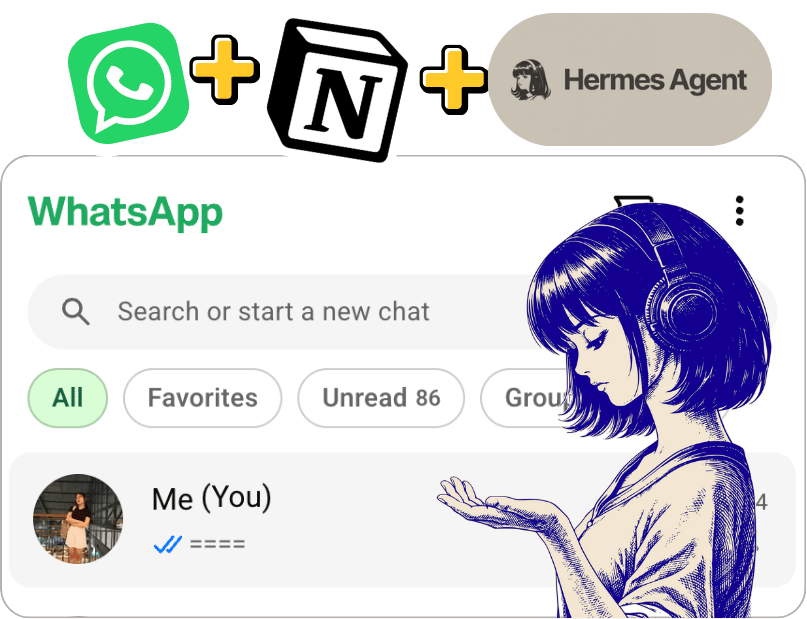
Okay, let me show you something embarrassing: my WhatsApp self-chat 🙈.

It’s a total mess of random ideas, to-dos, bugs to fix, shows to watch, and stuff I want to learn. I type them in, feel productive for about five seconds, and then… never open them again. Sound familiar?

So I gave that chaos a job. I connected Hermes to WhatsApp using Baileys. Now Hermes reads my messages, figures out what they’re about, organizes them in Notion, and can even do the follow-up work for me 🤖.

The idea: WhatsApp is the inbox, Notion is the organized memory, and Hermes is the one who actually gets things done.

🗺️ How Everything Connects

flowchart TD
    A["Me: WhatsApp self-chat"] --> B["Baileys: WhatsApp bridge"]
    B --> C["Hermes agent"]
    C --> D{"What does this message need?"}
    D -->|Save it| E["Notion: to-dos, ideas, notes"]
    D -->|Schedule it| F["Google Calendar"]
    D -->|Research / make something| G["Docs, Drive, Sheets, Word, Canva"]
    G -->|Attach result link| E
    C --> H["Reply on WhatsApp with the result"]
Tool Role
WhatsApp + Baileys Where I send my brain dumps; Baileys connects the chat to Hermes.
Hermes Understands, sorts, researches, and takes action.
Notion Stores short-term to-dos, long-term to-dos, and ideas.
Google Calendar Handles plans with a date and time.
Google Drive / Docs, Sheets, Word, Canva Holds anything Hermes creates, with links saved back to Notion.

💬 How I Talk to It

No fancy prompts needed! I just start each message with a category and, if I want, add a mode:

todo: take the laundry
todo: check Claude Academy (research)
todo: hangout with a friend on Tuesday at 4
idea: a website that converts selfies to ASCII art (research)
idea: a short story about a girl and her past (simple)
watching: Daredevil S2 EP4
  • todo: Something I need to do. Hermes files it under short-term or long-term to-dos.
  • idea: Something I might build, write, or explore. It goes on the ideas list.
  • watching: A quick progress note. It can live in a notes area for now, or a proper watchlist later.
  • (research) Don’t just save it! Look into it and make something useful.
  • (simple) Just save it to Notion. No research, no generated files, no essays.

If I don’t add a mode, Hermes goes for the simplest useful action. Because not every 2 a.m. thought deserves to become a whole project 😂.

🔨 Message → Action

I send on WhatsApp Hermes does
todo: take the laundry Adds a short-term to-do in Notion.
todo: check Claude Academy (research) Saves the to-do, researches learning resources, and links a short summary or learning plan.
todo: hangout with a friend on Tuesday at 4 Prepares a Calendar event; asks if the date or time needs clarification.
idea: a website that converts selfies to ASCII art (research) Creates an idea entry, researches feasibility, drafts a mini project plan, and attaches the document link.
idea: a short story about a girl and her past (simple) Saves the idea as-is. No unnecessary AI essay.
watching: Daredevil S2 EP4 Records where I left off; a dedicated media tracker is an optional extension.

📒 What an idea looks like in Notion

Field Value
Title Selfie → ASCII Art Website
Database Ideas
Status Researched
Original message idea: a website that converts selfies to ASCII art (research)
Output Link to feasibility notes / project plan

My favorite part: the research doesn’t get lost in the chat. The result stays attached to the original idea in Notion, right where I’ll look for it ✨.

Here’s how it looks in action:

🔁 From Brain Dump to Done

  1. Capture: I send a message to my WhatsApp self-chat.
  2. Understand: Baileys passes it to Hermes, which figures out the category and any instructions like (simple) or (research).
  3. Organize: Hermes creates or updates the right Notion entry (short-term to-do, long-term to-do, or idea).
  4. Act: If needed, it researches the topic, makes a doc, spreadsheet, or design, or handles a calendar action.
  5. Link back: Anything it creates gets linked in the Notion entry, so future me can find it.
  6. Confirm: Hermes replies on WhatsApp with a short summary and any useful links.

📏 A Few Rules That Keep It Useful

Rule Why
Simple means simple. Not every random thought needs research.
Keep the original message. I can still see what I actually meant.
Put output links next to the idea. No hunting through old chats for generated work.
Ask when details are missing. Especially for dates, times, or actions involving other people.
Prefer a useful artifact over a wall of text. A mini-spec, checklist, spreadsheet, or draft is easier to act on.

💭 Why I Built It

I don’t need another note-taking app. Trust me, I’ve tried plenty 🫠. What I need is for my existing notes to go somewhere, and sometimes turn into actual work.

With this setup, I keep using the easiest input I already have (just texting myself on WhatsApp), while Hermes handles the boring parts: sorting, researching, creating, and linking everything back together.

My self-chat is still a mess, but now it’s a mess that gets things done :3

Project note

3D Isometric Room Web

🔎 Overview

My portfolio pages were usually just… a list of links. Nothing wrong with that, but I wanted to make it more a place you can walk into instead of a page you scroll past.

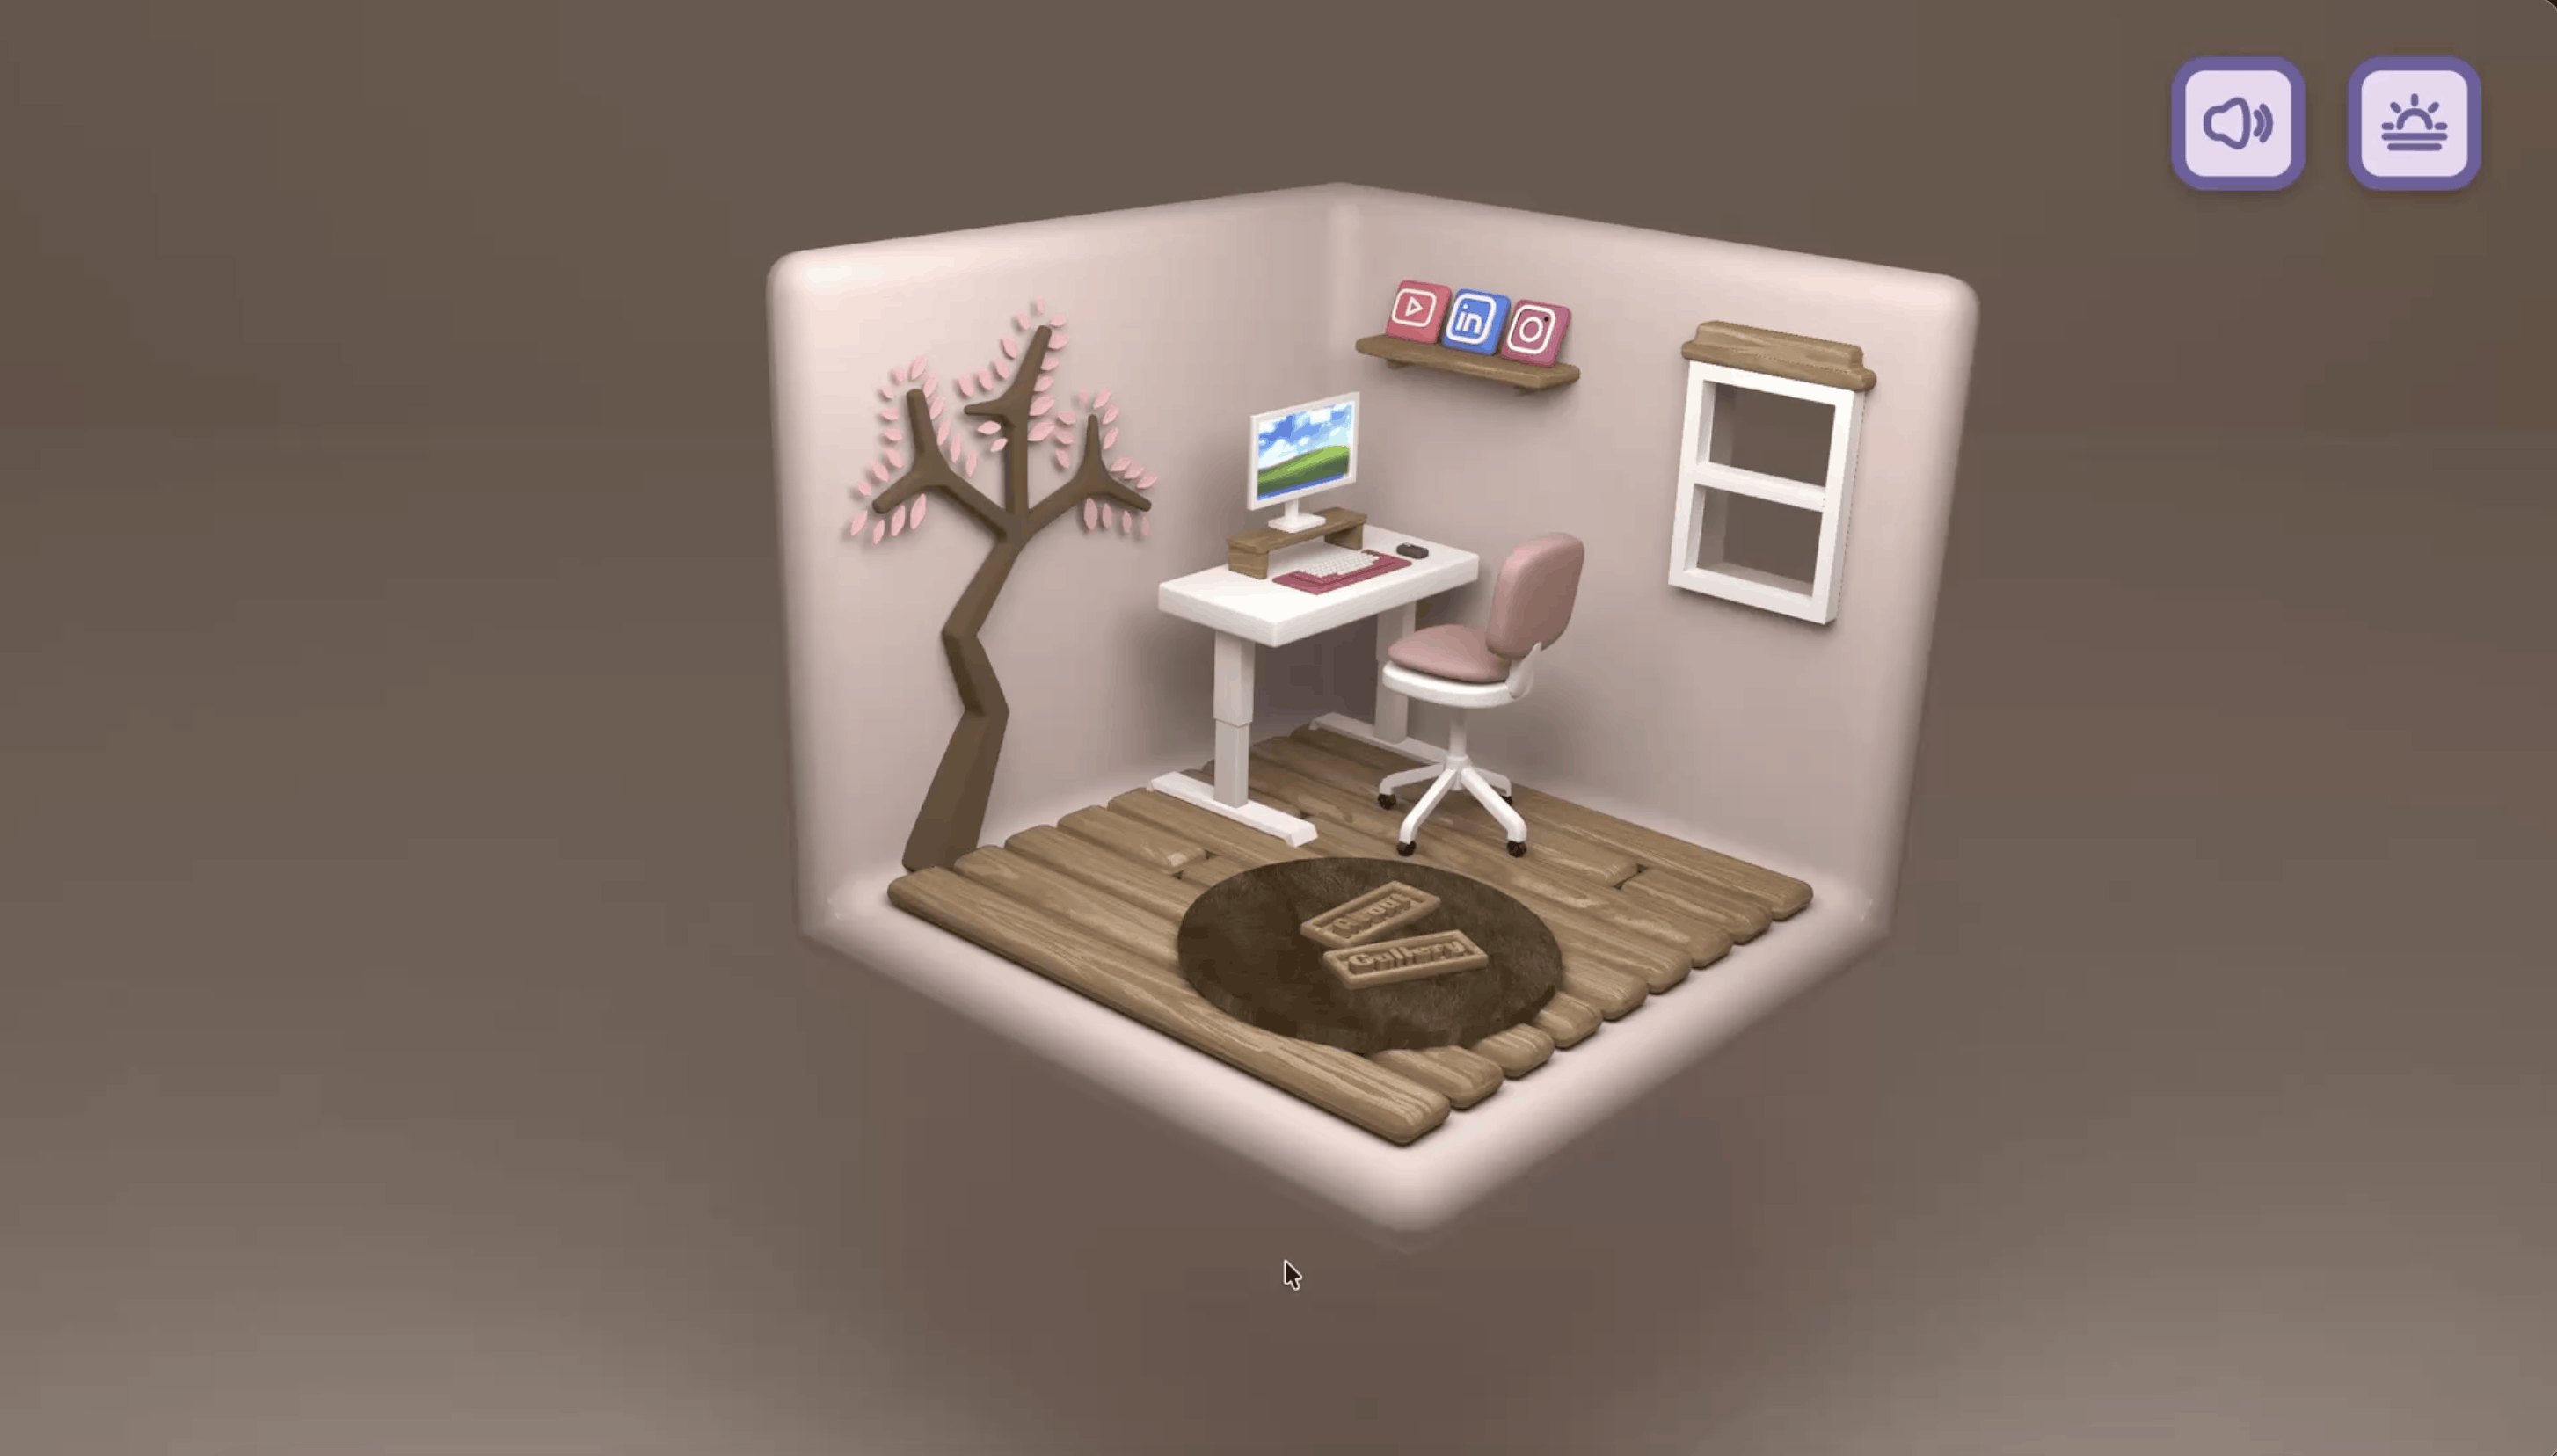
So I learned to build a 3D room~ Visitors can spin it around, zoom in, and poke at things in the browser. It’s a miniature portfolio world with animated social icons and little corners like Gallery, About, and Say Hello. I modeled the room myself in Blender by following an amazing FREE tutorial 🛋️.

Here’s the tutorial I followed (big thanks to the creator!): https://www.youtube.com/watch?v=AB6sulUMRGE

Quick summary before we go deeper:

  • Goal: Make a personal website feel like a space, not a list of links.
  • Built with: Blender (3D modeling), Three.js, GLTFLoader, OrbitControls, GSAP, Vite, and Sass.
  • Hosted on: Netlify.
  • Architecture: Everything runs client-side with WebGL. No separate API or database in the shared code.

🗺️ How Everything Connects

The simple version: Visitor → Website → 3D room → Camera controls and hover effects. That’s it!

The nerdy version:

flowchart LR
    U["Visitor"] --> N["Netlify<br/>Static site"]
    N --> B["Vite-built app<br/>HTML / JS / CSS"]
    B --> S["Three.js scene<br/>Camera · Lights · WebGL"]
    A["Custom Blender room<br/>Exported as .glb"] -->|GLTFLoader| S
    U -->|Drag / Scroll / Touch| C["OrbitControls"]
    C --> S
    U -->|Pointer movement| R["Raycaster"]
    R --> G["GSAP hover effects"]
    G --> S

And here’s who does what in this little room:

Piece What it does
Blender Used to create the original 3D room model.
Three.js Draws the room, camera, lights, and shadows.
GLTFLoader Loads the 3D .glb room model.
OrbitControls Handles rotation, panning, and zoom.
Raycaster + GSAP Detects social-icon hover and animates a lift-and-scale effect.
Vite + Sass Builds the app and handles the styles.
Netlify Hosts the static website.

🔨 So, What Happens When You Open It?

  1. The page loads. Your browser grabs the app and its WebGL canvas.
  2. The stage gets set up. Three.js prepares a perspective camera, ambient and directional lights, and a renderer with shadows turned on (because a room without shadows looks kinda sad).
  3. My handmade room moves in. The Blender model is exported as a .glb file, and GLTFLoader drops it into the Three.js scene.
  4. You explore. Mouse and touch gestures drive OrbitControls, so you can rotate, pan, and zoom all around the room.
  5. Things react to you. Raycasting checks whether you’re hovering over the Instagram, LinkedIn, or YouTube objects. If you are, GSAP lifts and enlarges them ✨, then puts them back when your pointer moves away.
  6. It keeps running. A requestAnimationFrame loop updates the controls and redraws the room every frame.

✨ The Little Details I Love

These are the bits that make the room feel alive (some of them I learned straight from the tutorial, and honestly, they were the most fun part to build):

  • Day and night mode 🌞🌙. Flip the theme toggle and the whole room changes mood. Under the hood, a custom GLSL shader blends baked day and night textures (four texture sets) with a mix value, so the switch is a smooth fade instead of a hard cut.
  • A computer that’s actually on. At night, the monitor plays a looping video on its screen using a Three.js VideoTexture. During the day it shows a plain wallpaper. Even the room’s PC goes to “sleep” mode, lol.
  • Steam that drifts upward ☕. A second shader scrolls a Perlin noise texture upward and softens the edges, so you get a gentle, wispy smoke effect.
  • Background music 🎶. There’s a cute pop song with a mute toggle. Since browsers block autoplay with sound, the music waits for your first click or tap before it starts.
  • Pop-up sections. Gallery, About, and Say Hello open as modals right on top of the 3D scene.
  • A loading screen that won’t trap you. If something fails while loading, the overlay still gets out of the way instead of leaving you stuck staring at it.

⚡ Performance & Cost Notes

Good news: this isn’t a backend-heavy project, so hosting is easy. The real things to watch are how big the 3D assets are and how hard the browser has to work.

Here’s what I’d tweak to keep it smooth:

Focus Practical improvement
Model loading Compress the .glb and textures; show a loading indicator.
Rendering Cap pixel ratio on high-DPI devices to reduce GPU work.
Interactions Skip unnecessary raycasting when the pointer hasn’t moved.
Accessibility Add keyboard-friendly links and reduced-motion options.
Hosting Keep deployment static and watch asset bandwidth as traffic grows.

🔮 What’s Next?

The live site already has Gallery, About, and Say Hello sections, though some of the content is still being curated (aka I’m still picking what to show, lol).

Next on my list: a fuller gallery, touch-friendly ways to activate the 3D objects, and a lightweight fallback for devices that struggle with WebGL.

And that’s my little room! Feel free to drop by and spin it around 🏠

Project note

Decision Maker: 9 Tools for Better Choices

Ever stood in front of two options for way too long, going “hmm… hmm… HMM” 🫠? Same.

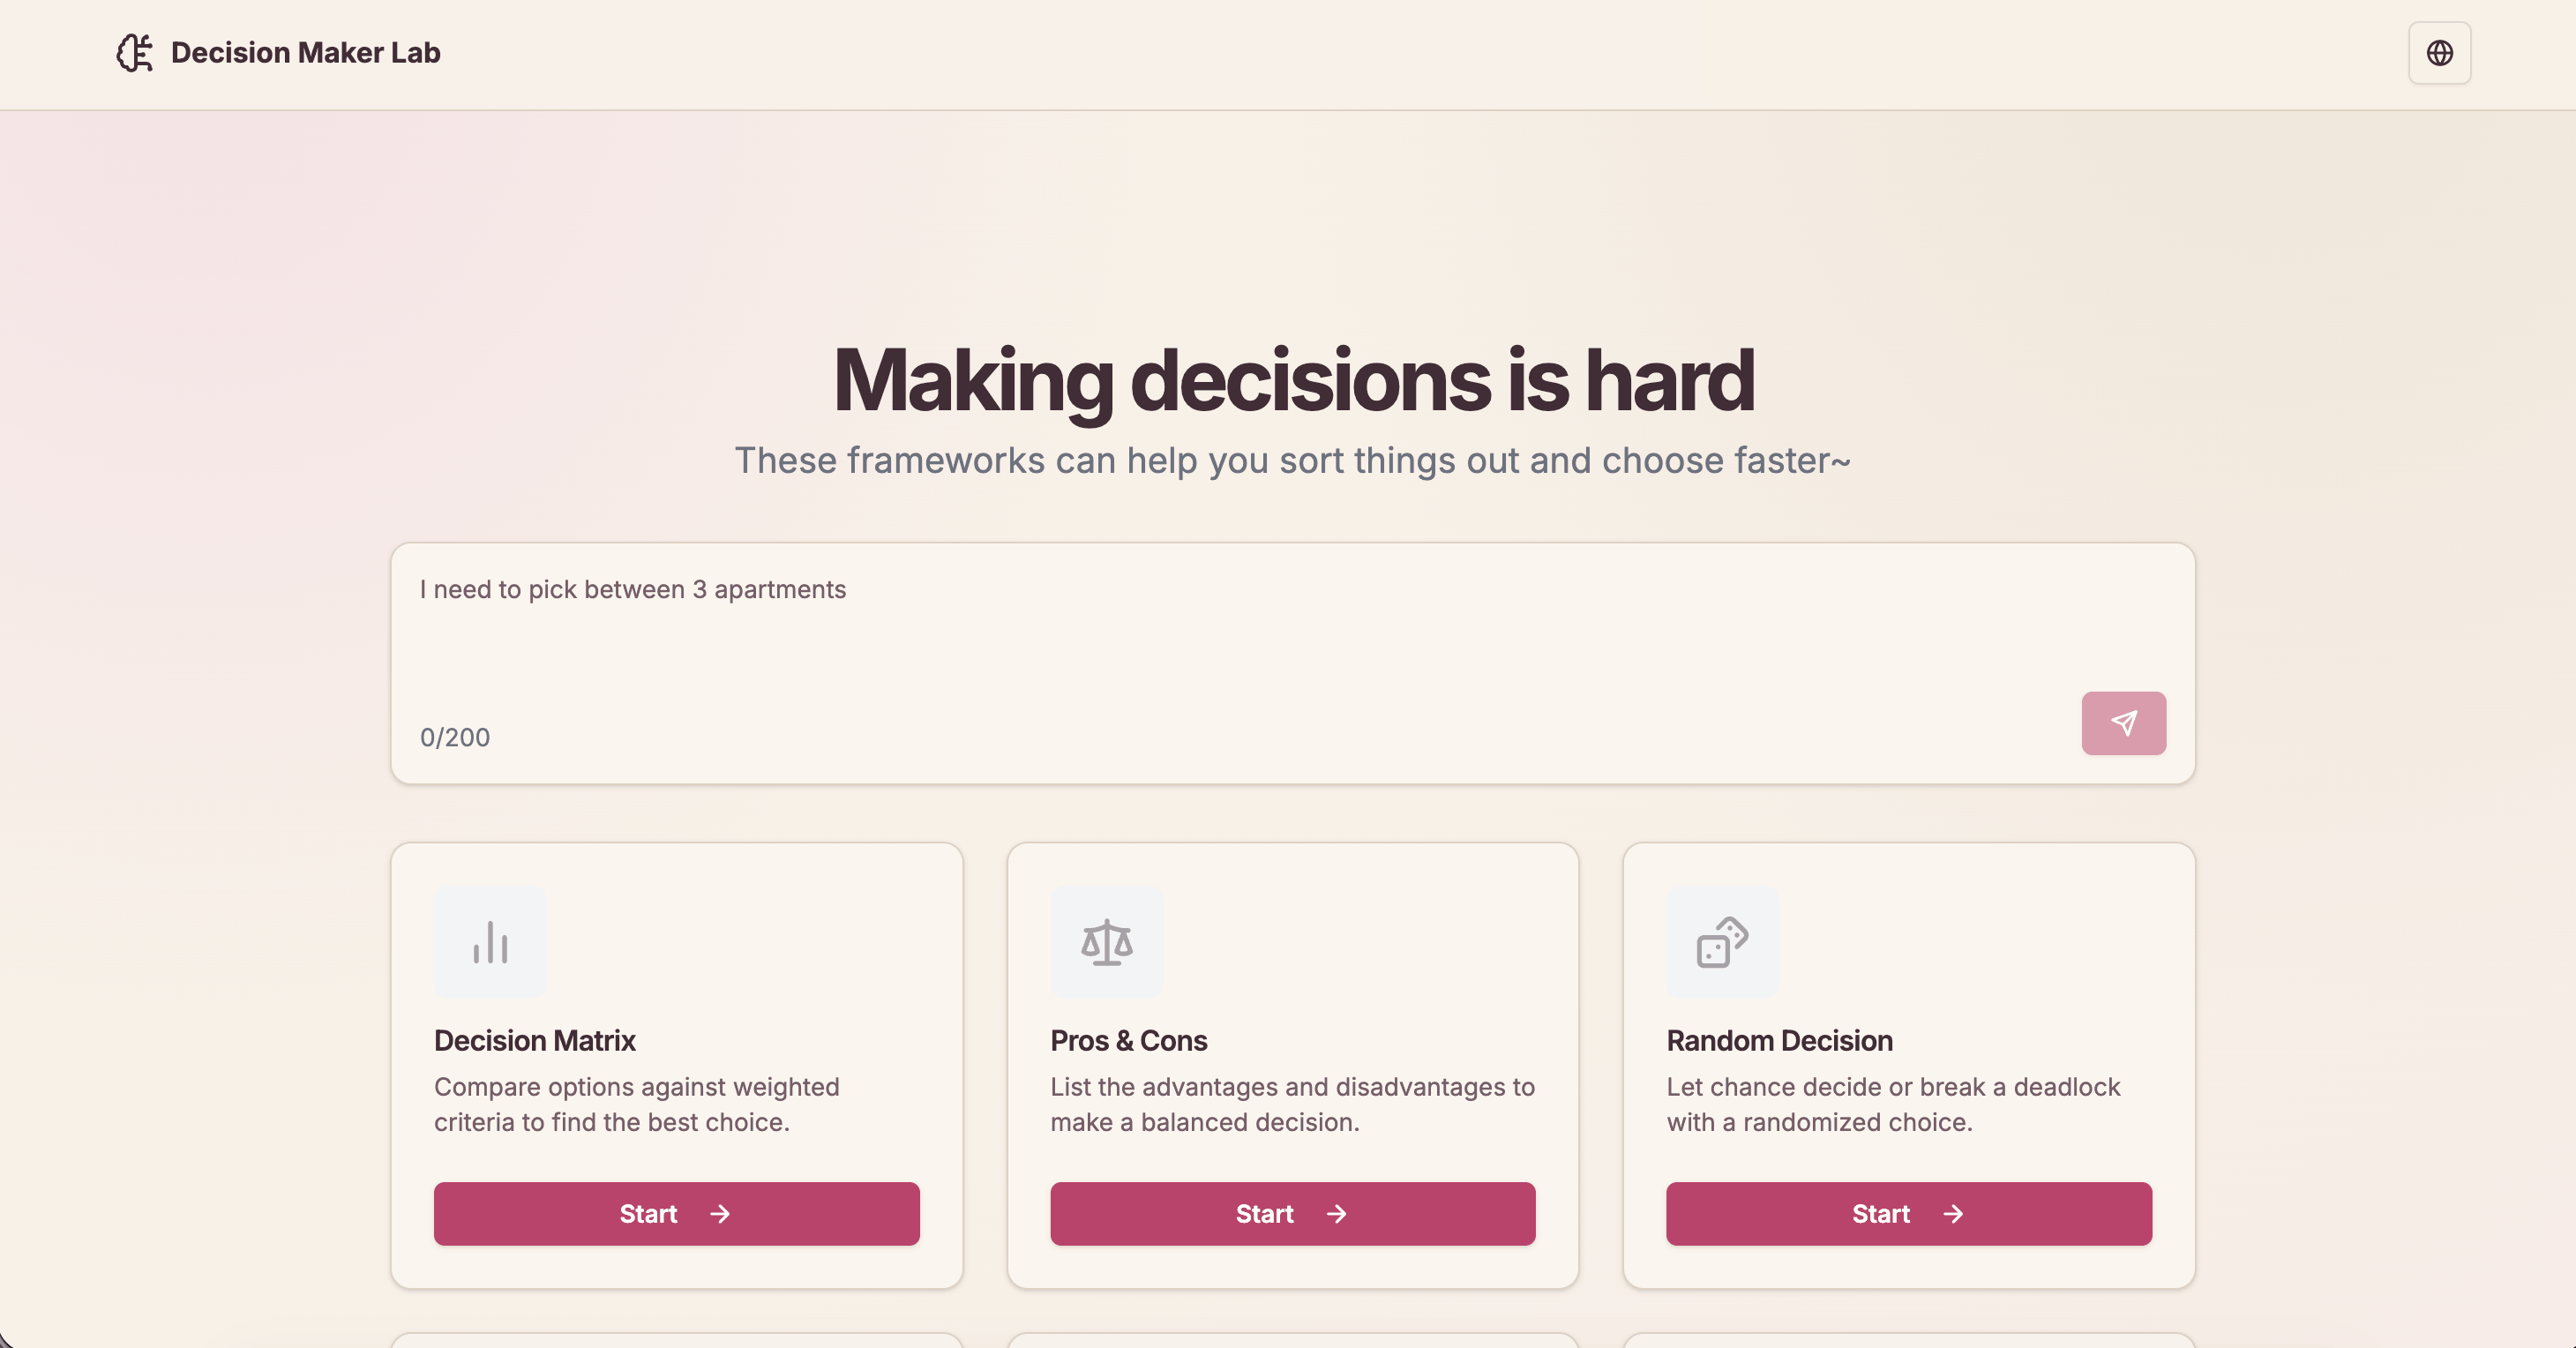
Sometimes picking between a few options is harder than it should be. So I built Decision Maker Lab: one simple app that brings together different ways of making decisions, whether it’s for work, planning, or “what should I eat tonight” level choices.

🔎 At a Glance

  • Built with: Next.js, React, TypeScript, and Tailwind CSS.
  • Nine tools: From Pros & Cons to Decision Trees and SWOT Analysis.
  • No database for your decisions: Everything is saved in your browser.
  • Extras: Shareable links, English and Indonesian support, CSV/JSON export, and optional AI suggestions.
  • Tested: 42 test files with Vitest, including checks that the English and Indonesian translations stay in sync.

🧰 The Nine Tools

Tool Good for
Pros & Cons Listing the upsides and downsides.
Decision Matrix Scoring options against your priorities.
Cost-Benefit Analysis Comparing what you spend and what you gain.
Decision Tree Looking at possible outcomes.
Eisenhower Matrix Sorting tasks by urgency and importance.
SWOT Analysis Finding strengths, weaknesses, opportunities, and threats.
Scenario Planning Thinking through different situations.
Random Decision Picking when you can’t decide.
Weighted Random Giving some options a better chance.

My personal favorite? Weighted Random. It’s for when you kinda know what you want but still want the universe to decide 🎲.

🗺️ How It’s Built

flowchart TB
    subgraph Browser
        U[User] --> T[Decision Tools]
        T <--> L[(Local Storage)]
        T --> S[Compressed Share URL]
    end

    subgraph NextJS[Next.js Server]
        K[Private Server Secret] --> API[POST /api/token]
    end

    subgraph Worker[AI Worker]
        AUTH[POST /authorize]
        GEN[POST /generate]
    end

    T -->|Request token| API
    API -->|Authenticate with secret| AUTH
    AUTH -->|Issued token| API
    API -->|Issued token| T
    T -->|Prompt + token| GEN
    GEN -->|AI suggestions| T

Most of the app works right in your browser. The AI Worker only gets involved when you ask for suggestions.

About those share links 🔗: your whole decision gets packed into the URL itself, compressed with lz-string so the link doesn’t turn into a novel. No server needs to store anything. Send it to a friend, and they see exactly what you made.

🔐 Why I Added a Token Endpoint

I wanted AI suggestions without putting a private API key in the frontend (because anyone can peek at client FE code). So I added a small server-side step:

  1. The browser calls POST /api/token on the Next.js server.
  2. The server uses its private JWT_SECRET_KEY to call the Worker’s /authorize endpoint.
  3. The Worker returns an issued token, and Next.js passes it back to the browser.
  4. The browser calls the Worker’s /generate endpoint using that token.
  5. The Worker sends AI suggestions back to the decision tool you’re using.

This keeps the private secret on the server. But the issued token is still visible to the browser, so it needs its own safety limits too.

🤔 Decisions I Made (and What They Cost)

Yes, a decision-making app has a decision table. Very meta 😄.

Choice Why I chose it Trade-off
Browser localStorage Save decisions without accounts or a database. No automatic sync across devices.
Compressed share URLs Share decisions without storing them on a server. The link contains the data; compression isn’t encryption.
Server-side token endpoint Keep the private Worker secret out of client code. A public token endpoint can be abused without safeguards.
Direct calls to AI Worker Avoid sending every AI request through Next.js. Issued tokens reach the browser and need protection.

🔮 What I’d Improve Next

  • Protect the AI endpoints: Add rate limits and usage quotas to /api/token and the Worker’s /generate endpoint. If the app ever gets accounts, tie limits to users.
  • Tighten token handling: Use short-lived tokens, validate them in the Worker, limit what they can access, and maybe keep them in memory instead of localStorage.
  • Review the other AI route: There’s also an /api/ai route that calls DeepSeek with a server-side API key. It needs the same safeguards, or it should go if it’s not needed anymore.
  • Make sharing safer: Remind people not to put private info in share links, since compression isn’t encryption. Add size limits or private sharing later if needed.
  • Performance and SEO: I made this when I was first learning Next.js, so there’s a lot of room to grow. For example, the first load takes a bit too long 😂.

💬 Closing

The goal was never to let AI make every decision for you. It’s about giving you a clearer way to think through your options, with AI around when a little extra help is useful.

Project note

Job Application Logger: Track Applications Without the Copy-Paste

Job hunting is already a full-time job 😮‍💨. And then there’s that other job: keeping your application spreadsheet updated after every single submission. Copy the company name, switch tabs, paste. Copy the role, switch tabs, paste. Copy the link… you get it.

Honestly? That’s the part I kept forgetting. So I built a little helper for it.

Job Application Logger is a Chrome extension that reads the job details from your browser and drops them straight into a Google Sheet. Less tab-juggling, more applying 🙌.

🔀 Two Ways to Log an Application

One-click logging Auto-detect
How it starts Open the extension on a job page and click Add to Google Sheet. The extension spots a submission confirmation.
Where it works Regular job pages, including sites outside the supported list. Supported job platforms only.
Before saving Review or edit the details, status, and notes. Saves the detected details automatically.
Best for Staying in control of every entry. Reducing repetitive steps after applying.

Auto-detect works on LinkedIn, JobStreet, Glints, Greenhouse, Lever, Ashby, and Workday (JobStreet across six regional sites, from Indonesia to Thailand). It’s optional and off by default, because I don’t like surprise automation either 😄.

🗺️ From Job Page to Spreadsheet

flowchart LR
    A[Job page] --> B[Read job details]
    B --> C{Logging mode}
    C -->|One click| D[Review and save]
    C -->|Auto-detect| E[Spot submission confirmation]
    D --> F[Google Apps Script]
    E --> F
    F --> G[(Google Sheet)]

The extension hunts for the company, role, location, and job URL. It tries three approaches, in order:

  1. Structured job data (JobPosting JSON-LD), when the page has it. The best case!
  2. Site-specific page elements for the supported platforms.
  3. General page details as a last resort.

For auto-logging, it keeps an eye out for messages like “Thank you for applying” or “Your application has been submitted.” Lots of job sites are single-page apps that swap content without reloading, so the extension uses a MutationObserver to notice when that confirmation message actually shows up.

A couple of smart little touches:

  • The confirmation page forgot the job? No problem. If the job info disappears after you submit, the extension reuses the details it captured a moment earlier.
  • No duplicate rows. It skips repeat automatic logs for the same job within 30 minutes.
  • No row collisions either. On the Sheets side, the Apps Script uses a lock before adding a row, so two logs arriving at the same time don’t trip over each other.

Behind the scenes, a Chrome Manifest V3 extension (about 1,000 lines of plain JavaScript, no framework) sends the entry to a Google Apps Script web app, which adds a new row to Google Sheets. No separate database needed! Your connection settings sync through Chrome, so they follow you to your other signed-in browsers.

📋 What Gets Saved?

Each row includes:

  • Job details: company, role, location, and URL.
  • Application details: application date, status, and optional notes.
  • Tracking details: source platform, manual/auto mode, any detected confirmation text, and when the row was logged.

So everything lives in one place where you can review and update progress, instead of digging through browser history and confirmation emails 📬.

🚀 Getting Started

  1. Create a Google Sheet and add the project’s Code.gs under Extensions → Apps Script. Set a long, unique shared secret.
  2. Deploy the script as a web app the extension can reach, then copy its /exec URL.
  3. Load the extension from its project folder via chrome://extensions → Developer mode → Load unpacked.
  4. Connect it in the extension’s Options with the web app URL and shared secret. Try a manual log first, then turn on auto-detect if you like it.

⚠️ A Few Things Worth Knowing

  • Auto-detect isn’t magic. Job sites change, and some confirmation screens might not be recognized. Peek at your Sheet to make sure the entry made it.
  • Manual logging is your backup. On unfamiliar pages, a few fields might need a quick fix before saving.
  • Permissions are kept small. The extension only asks for storage, the active tab, and scripting. Automatic page access is limited to the supported job platforms, and manual logging only touches the tab you choose.
  • It’s a personal-use setup. The Apps Script endpoint uses a shared secret, not a full login system. Keep that secret private, and please don’t treat this as production-grade multi-user security.

💬 Closing

A job tracker is only useful if it’s actually up to date. Job Application Logger keeps it simple: apply for the role, capture the details, and let Google Sheets hold the record.

Less admin, more applying. Good luck out there! 🍀

Project note

Threads Constellation: Turning Conversations Into a Night Sky

Most social apps show conversations as one loooong feed. Scroll, scroll, scroll…

So I asked myself: what if a conversation network looked like a night sky? 🌌

That’s Threads Constellation. Each post becomes a star, replies branch out like trails of light, and whole conversations form their own little galaxies. Instead of scrolling through it, you get to explore it.

🔎 Overview

  • Goal: Turn Threads conversations into a searchable, interactive star map.
  • Core stack: Cloudflare Pages, Pages Functions, Workers, D1, and plain JavaScript with HTML Canvas.
  • Special feature: Match a conversation to a real constellation figure when their visible star counts line up and their connection patterns look alike.
  • Best part: Every star is still a real post or reply. It’s pretty, but you never lose the actual conversation ✨.

🗺️ How Everything Connects

The nerdy view

flowchart TB
    Visitor["Visitor"] --> Pages["Cloudflare Pages: HTML, CSS, JS"]
    Pages --> Canvas["Interactive Canvas sky map"]

    Canvas -->|GET /api/constellation| Proxy["Pages Function: API proxy"]
    Proxy --> Worker["Cloudflare Worker"]
    Threads["Threads API"] --> Worker
    Worker <--> D1[("Cloudflare D1")]

    Canvas -->|GET /api/constellation-catalog| Catalog["Pages Function: sky catalog"]
    Catalog --> Sky["D3-Celestial: J2000 constellation lines"]

The simple view: Threads data turns into connected stars. Then the app peeks at a catalog of real sky patterns to see if any conversation can take the shape of a constellation you’d recognize.

Component What it does
Cloudflare Pages Serves the public website.
Pages Functions Connects the frontend to two same-origin API endpoints.
Worker + D1 Provides Threads conversation data through the backend API.
JavaScript Canvas Draws and animates the star map.
D3-Celestial Provides real constellation line coordinates and names.

🔨 From Posts to Stars, Step by Step

  1. Grab the conversations. A Cloudflare Worker with a D1-backed API makes Threads posts, replies, and how they’re connected available to the site.
  2. Load the map. The browser calls /api/constellation through a Pages Function. Since the request stays on the same origin, no annoying CORS issues 🙌.
  3. Build the stars. Posts and replies become nodes, and reply relationships become lines. Anything without visible text gets left out, and each conversation is grouped together.
  4. Look for a sky match. A second endpoint, /api/constellation-catalog, serves cached astronomy data. To match, a conversation needs the exact same number of nodes as a real constellation figure. Then the app compares connections and branching to pick the closest fit.
  5. Draw it! Matching groups take the real figure’s projected positions, with faint gold reference lines. Everything else gets a natural, branching layout.

Heads-up: the data refreshes every 30 seconds while the tab is visible. It’s regular polling, not a live stream.

🛠️ Behind the Scenes: The Sync Worker

This is the part nobody sees, but I’m kinda proud of it 🤭.

Visitors never talk to the Threads API directly. Instead, a Cloudflare Worker runs on a Cron schedule every minute and does the heavy lifting:

  • It plays nice with rate limits. Each sync has a budget of 45 Threads API requests (fetching up to 20 posts and 50 replies per page), and 8 of those are saved for backfilling older posts so the history slowly fills in over time.
  • It merges, then packs. New data is merged into the existing sky, then the whole snapshot is gzip-compressed and split into chunks of up to 1.5 MB to fit nicely in D1.
  • It skips pointless writes. Each snapshot gets a SHA-256 hash. If nothing changed since last time, nothing gets rewritten. Lazy in a good way!
  • It serves from cache. The public /api/constellation response is cached at the edge for 10 seconds, so lots of visitors don’t mean lots of database reads.

The database itself is tiny and simple: one table that points to the latest snapshot, one for the compressed chunks, and one for sync state.

✨ What You Can Do

  • Wander around: Drag to pan, scroll to zoom, and double-click to fit the whole map.
  • Follow the replies: Posts and replies have different star styles, and lines show how they connect.
  • Search and jump: Look up usernames, posts, replies, or text, then smoothly zoom right to it. Press / to open search.
  • Uncover sky patterns: Click a clue like The Hunter and boom, Orion (Ori) shows up.
  • Read the real thing: Click a star to see the author, text, timestamps, and a Threads link when available.

🤔 Decisions I Made (and What They Cost)

Decision Why it works Trade-off
Canvas rendering Makes custom star effects, movement, and zooming possible without a heavy UI framework. Drawing and interactions need custom JavaScript.
Same-origin API proxy Keeps browser requests simple and avoids cross-origin setup. Adds one more hop to the backend.
Node count + graph matching Makes constellation shapes depend on the actual conversation structure. Matches are approximate; not every conversation qualifies.
Stable, spaced-out layouts Groups stay recognizable between refreshes and have room to breathe. Positions are designed for readability, not real-world distance.

💸 Cost & Performance

The site is mostly static, so there’s no always-on web server eating money in the background. I also made a few choices to avoid doing the same work over and over:

  • Cache the astronomy catalog: Constellations don’t exactly change every day (lol), so the catalog uses browser and edge caching.
  • Only refresh when it matters: The map polls while you’re looking at it, and checks again when you come back to the tab.
  • Keep the frontend light: Plain HTML, CSS, JavaScript, and Canvas run the whole interface. The usage-based costs come from API requests, Worker execution, and D1 operations.

Real cloud costs depend on traffic and data, so I can’t give you an honest flat monthly number without actual usage.

🔭 Wait, Are the Matches “Real”?

Short answer: it’s art, not astronomy 😄.

The map is a creative visualization, not a scientific claim that online conversations naturally form star patterns. It uses equal node counts and similar graph structure to place conversations onto figures you’d recognize. If nothing matches, the conversation still shows up as its own organic star cluster. Every chat gets to shine!

The astronomy reference comes from D3-Celestial (BSD-3-Clause). Also, a fun fact: the International Astronomical Union recognizes 88 constellation names and sky regions, but there’s no single official way to draw their stick-figure lines.

💬 Closing

Threads Constellation makes reply chains easier to explore and way more fun to look at. Simple idea, creative twist: turn a conversation graph into a night sky, without losing the real stories behind the stars.

Go stargazing! 🌠

Project note

Build Starter: Plan the App Before AI Writes the Code

AI can write code in seconds. Cool! But getting it to build the right thing? That’s the hard part 😅.

A short prompt might describe the feature, but it usually leaves out the important stuff: who the users are, what the data rules are, how security works, how the pieces fit together. And then the AI fills in the blanks… with its own guesses.

So I made Build Starter. It doesn’t generate code. Instead, it helps you give your AI coding assistant a better blueprint to work from. Plan first, code later 📐.

🔎 Overview

  • Goal: Turn product ideas into structured, editable project docs before anyone (or anything) starts coding.
  • Best for: Developers planning a website, an API-backed app, or a service-heavy system.
  • What you get: 22 Markdown templates, Mermaid diagram helpers, and single .md or ZIP downloads.
  • Under the hood: Plain HTML, CSS, and JavaScript. No framework, no database, no backend, no account.

Fun fact: this very portfolio site was planned with Build Starter 🙋‍♀️. The docs/ folder and AGENTS.md in its repo came straight from these templates. I eat my own cooking!

🗺️ How Everything Connects

Build Starter runs entirely in your browser. Templates give you the starting content, your edits are saved locally, and the finished docs can be exported and dropped into a repo or handed to a coding assistant.

flowchart LR
    A[Developer] --> B[Build Starter Web App]
    C[22 Markdown Templates] --> B
    B <--> D[(Browser localStorage)]
    B <--> E[Mermaid Diagram Helper]
    B --> F[Markdown or ZIP Export]
    F --> G[Project Repository / AI Coding Assistant]

The simple version: pick a template, describe your system, add a diagram if you need one, and export. No server ever touches your drafts.

🔨 How It Works

  1. Choose your project shape. Start with Simple web, App / API, or Service-heavy.
  2. Keep what matters. Each template is marked Required, Recommended, or Optional for that shape. Optional files stay hidden unless you want them.
  3. Fill in the decisions. Problem, user flows, architecture, APIs, security rules, and whatever else your project actually needs.
  4. Sketch the system. Generate editable Mermaid code for a flowchart, ERD, sequence diagram, or service map, then pop it into a doc.
  5. Export the handoff. Download one Markdown file, or a ZIP with your selected docs plus AGENTS.md and MASTER_PROMPT.md.

📏 Pick the Right Level of Detail

Not every project needs a distributed-systems playbook. (Your landing page does not need an event-driven architecture doc, I promise 😆.) The presets keep the docs proportional to the work:

Project shape Good fit Documentation focus
Simple web Landing pages, static sites, small frontends Scope, UI, requirements, testing, engineering rules
App / API Full-stack apps with a backend and database Domain model, architecture, storage, API contracts
Service-heavy Multiple services, workers, or integrations Service boundaries, events, resilience, operations

The templates also keep commonly mixed-up topics apart: authentication vs. authorization, domain models vs. database schemas, and today’s requirements vs. future ideas. That last one is my favorite, because it stops “maybe someday” ideas from sneaking in as accidental features.

📦 What’s in the Export?

Just normal Markdown files. No weird proprietary format! For example:

docs/
  00-project-brief.md
  01-requirements.md
  08-system-architecture.md
  09-database-design.md
  10-api-design.md
  ...
AGENTS.md
MASTER_PROMPT.md

The exact docs/ files depend on your preset and which optional templates you turned on. The two files at the root give guidance and context for working with coding agents.

And a little nerdy detail I’m proud of 🤓: the ZIP isn’t made with a library. I wrote a tiny ZIP builder (under 90 lines) that calculates its own CRC-32 checksums and packs the files right in the browser. Zero dependencies, still opens in any unzip tool.

🤔 Decisions I Made (and What They Cost)

Decision Why it works Trade-off
Static, dependency-free app Opens locally and can be hosted almost anywhere No built-in team workspace or server features
Browser localStorage Drafts survive page refreshes without an account No cross-device sync; browser data can be cleared
Markdown-first output Easy to review, version in Git, and give to an LLM Structure still depends on people filling in good details
Mermaid code helpers Quickly drafts common technical diagrams Diagrams are editable code, not a visual drag-and-drop designer
Minimal Markdown preview Keeps the tool lightweight Not a full Markdown or Mermaid rendering environment

🎯 When Is It Helpful?

Reach for Build Starter when your project is still taking shape, your requirements are scattered all over the place, or your AI assistant needs more context than one prompt can hold. It’s especially nice for turning architecture decisions into files that live right next to your code.

💬 Closing

Better AI-assisted development starts with a clearer spec. Build Starter just makes that first step light enough that you’ll actually do it.

Plan a little, build a lot! 🧱

Project note

Effort to Buy: What Does a Purchase Cost in Work Hours?

Here’s a thought that stuck in my head: a low price doesn’t always mean something is affordable. 🤔

A cup of coffee might be cheaper in one country, but take way more hours of work to pay for. Price tags alone don’t tell you that. So I built Effort to Buy (Pay-tience) to make that difference easy to see. (Yes, the name is a pun. Pay + patience. I’m not sorry 😆.)

🔎 Overview

  • Goal: Turn everyday prices into estimated working time, so comparing countries actually makes sense.
  • Coverage: 48 countries and 52 categories, including food, transport, clothing, housing, and utilities.
  • Key features: Searchable item and country pickers, card and table views, and links to the original price and wage sources.
  • Tech stack: React, Vite, CSS, CSV datasets, and Netlify for static hosting.
  • Architecture: Fully client-side. No database or backend needed to crunch the numbers.
  • Built in: About three days, from first commit to styled and deployed 🏃‍♀️.

🗺️ How Everything Connects

flowchart TD
    A[CSV data: prices, wages, flags, emojis] --> B[Vite build]
    B --> C[Static React app on Netlify]
    C --> D[Visitor's browser]
    D --> E[Select an item and countries]
    E --> F[Calculate work hours]
    F --> G[Card or table view]

All the data gets bundled into the site during the build. Once the app loads, filtering and math all happen right in your browser, with no live pricing API involved.

🔨 How It Works

  1. Pick an item, like a cappuccino, a meal, or a monthly transport pass. Every item even gets its own emoji ☕🍜🚌.

  2. Choose countries to compare, or just keep them all. Indonesia stays pinned as my home reference.

  3. Match the data: The app pairs each country’s item price with its monthly minimum wage using country IDs.

  4. Do the math with USD-converted numbers from the dataset:

    Work hours = (Item price in USD / Monthly minimum wage in USD) × 173.33

    Where does 173.33 come from? It assumes 40 hours a week: 40 × 52 weeks ÷ 12 months ≈ 173.33 hours per month.

  5. See the results: Card view shows up to 12 comparisons. Table view shows everything, including local prices, wages, and source links. Results are sorted by effort, with Indonesia always first.

Show your sources! I really wanted the numbers to be checkable. Click a country name to open its minimum-wage source, or click an effort value to open the item-price source, both in a new tab.

☕ Example: How Much Work Does a Cappuccino Cost?

Country Cappuccino price Monthly minimum wage Estimated work
Indonesia $1.54 $203 1.3 hours
United States $5.42 $1,257 45 minutes

So the cappuccino is cheaper in Indonesia, but takes almost twice as long to earn on minimum wage. That’s exactly the kind of thing this app is for!

Figures come from the app’s dataset dated June 10, 2026. They’re here to show the calculation, not a live price quote.

🤔 Decisions I Made (and What They Cost)

Area Decision Why it works Trade-off
Data Bundle CSV files with the app Simple setup; no database or live data API Refreshing the figures requires a new build
Affordability Compare work hours, not just prices Gives a more relatable cross-country comparison Minimum wage doesn’t reflect everyone’s income
UI Provide card and table views Quick scanning or detailed comparisons Cards show only the first 12 results
Transparency Link results to wage and price sources Readers can check where the numbers came from Source data and methodologies may change

💸 Cost & Performance

A static React app fits this perfectly. Netlify serves the site, and your browser does the math. So there’s no server work or database hit for every comparison.

The one thing to watch as it grows: every visitor downloads the CSV data. Smaller datasets, validating data when updating it, or loading data in chunks would help keep it snappy.

⚠️ What the Numbers Don’t Tell You

These are helpful estimates, but not a full cost-of-living measure:

  • Minimum wages can differ by region, type of worker, and local rules.
  • The math ignores taxes, take-home pay, and personal expenses.
  • Prices and exchange rates change. The dataset is a dated snapshot, not real-time info.

💬 Closing

Two price tags can look super different, but working time adds a whole new perspective. Effort to Buy turns that idea into something simple you can explore yourself.

Go check how many hours your favorite snack costs around the world 🌍

Project note

MLBB Heroes Dashboard

A simple dashboard to explore Mobile Legends heroes, stats, and trends.

This isn’t my first MLBB dashboard. Back in 2021, I made one in Tableau (here it is, for nostalgia).

Fast forward a few years: new heroes, new meta, and me wondering “who’s actually strong right now?” So I rebuilt it from scratch, this time with my own data pipeline and a web dashboard 🎮.

🔎 Overview

  • Goal: Make hero stats easy to explore without building a full backend.
  • Use cases: Compare heroes, spot popular picks, check ban rates, and explore roles.
  • Tech stack: Python, CSV, Vite, TypeScript, Papa Parse, and Chart.js.
  • What you get: Interactive charts, role/year/hero filters, KPIs, and rankings.
  • Data: A 132-hero CSV snapshot, not live game data.

🗺️ How Everything Connects

The nerdy view:

flowchart LR
    API["Hero List + Rank Data"] --> PY["Python Scraper"]
    OLD["2021 CSV Baseline"] --> PY
    PY --> CSV["Latest Hero CSV"]
    CSV --> WEB["Static Website"]
    APP["Vite + TypeScript"] --> WEB
    WEB --> USER["Browser"]
    USER --> PARSE["Parse"]
    PARSE --> CHART["Chart.js: Charts + Filters"]

The big-picture view:

flowchart LR
    A["Game Stats"] --> B["Python Collects Data"]
    B --> C["CSV File"]
    C --> D["Website"]
    D --> E["You Explore Charts"]

Easy way to remember: Python prepares the data. The website shows it. Your browser handles the filters.

🔨 From Game Stats to Charts

  1. Collect: Python grabs hero details and win/pick/ban stats.
  2. Combine: It matches everything up and fills some older fields from my 2021 CSV.
  3. Save: The result becomes mlbb_hero_latest.csv.
  4. Load: The website reads the CSV with Papa Parse.
  5. Explore: Chart.js draws the charts, and clicking filters updates them instantly.

Heads-up: Visitors never call the game’s data APIs. New stats mean a new CSV and a new deploy.

🕵️ The Scraper Is Sneakier Than It Looks

This is the part I underestimated. Getting the data was a little detective game 🔍.

  • No hardcoded hero list. The scraper (about 550 lines of Python, standard library only) starts from the game’s own bootstrap config, follows it to the dynamic config, and discovers the current versioned hero list URL from there. So when the game updates its file paths, the scraper still finds them.
  • Plan A and Plan B. Win, pick, and ban rates come from the official rank API (with pagination). If that’s unavailable, it falls back to the older rank CDN files.
  • Knobs for days. Command-line options let me choose the rank tier, match type, page size, and request timeout.
  • Old meets new. Hero names are normalized before matching, so the fresh data can merge cleanly with my 2021 baseline and keep the same column format.
  • Bye, fake heroes. The game data had obvious placeholder entries like “Test Swordsman” and “Reserved String” 😂. They’re filtered out by default (you can include them with a flag if you’re curious).
  • Tested. A few unit tests cover the scraper’s helper logic.

🤔 Decisions I Made (and What They Cost)

Area Current choice Why it’s nice Trade-off
Data collection Python scraper Easy to rerun Needs a refresh process
Data storage CSV file Simple and portable No built-in history
Frontend Vite + TypeScript Fast, lightweight Work happens in the browser
Charts Chart.js Interactive out of the box Less custom than D3
Hosting Static site No always-on backend Not live by default

📊 What’s in the Dashboard?

Feature What it tells you
Win / Pick / Ban stats How heroes perform and how often they’re chosen or banned
Bubble chart Pick rate vs. win rate, with ban pressure
Role & release charts Hero mix by role and known release year
Top picked / banned Quick hero rankings
Clickable filters Focus on a role, year, or specific hero

🔭 Okay, But How Do I Read It?

What you see How to read it
Summary cards Filtered Heroes is the count. Average Win/Pick shows up after you filter. Most Contested has the highest pick rate + ban rate.
Pick vs. Win bubbles Compare popularity, win rate, and ban pressure. See the corner guide below.
Role Share Bigger slice = more heroes in that role, not a stronger role.
Release Rhythm Taller stacked bar = more heroes released that year; colors separate roles.
Top Picked / Banned Longer bar = higher pick or ban rate. Popular doesn’t always mean powerful.
Meta Insights + Leaderboard Quick highlights and a combined impact score based on win (20%), pick (45%), and ban (35%).

🫧 The Bubble Chart, Explained

Each bubble is one hero. Its position shows popularity and performance, and its size shows how often it gets banned.

  • X-axis (Pick Rate): Further right = picked more often.
  • Y-axis (Win Rate): Higher up = wins more often.
  • Bubble size (Ban Rate): Bigger = banned more often.
Position What it means If the bubble is big…
↗ Top-right Popular and wins a lot. Likely a strong meta pick. Highly contested: picked often and banned often.
↖ Top-left Rarely picked but wins a lot. Could be a hidden gem or niche pick. Often banned despite fewer picks; bans might limit opportunities to pick it.
↘ Bottom-right Popular but wins less. Common pick, mixed results. Still attracts bans, possibly due to annoying matchups or reputation.
↙ Bottom-left Rarely picked and wins less. Usually a situational or lower-priority pick. May face targeted bans even if its overall results look weak.

Quick takeaway: a big bubble doesn’t automatically mean a strong hero. It just means it gets banned a lot (maybe everyone’s just tired of facing it, lol). Read all three stats together. And remember, corners are relative to the other heroes on screen, especially after filtering.

Try it: Click a role, year, or hero to filter the charts. See what changes, then hit Reset all filters to start over.

Keep in mind: A high win rate with only a few picks isn’t proof that a hero is the best. This is a data snapshot, not match-by-match analysis. Heroes with a missing release year may show up as 0.

💸 Cost & Performance Tips

Part Keep it simple by…
Hosting Using static hosting and CDN caching
CSV Compressing and caching the file
Charts Keeping browser rendering lightweight
Data updates Refreshing on a schedule instead of every visit
  • Cost advantage: No running server or database needed for the current dashboard.
  • Honest note: Actual monthly cost depends on hosting and traffic, and I don’t have billing data to share.

🔮 What’s Next?

Idea Change Good for
Auto refresh Schedule the Python script Keeping stats more current
Data history Save dated CSV snapshots Comparing trends over time
Quality checks Validate missing and unusual values More reliable charts
API + database Add a backend later Larger data and advanced queries

📝 Design Journal, in a Nutshell

  • Problem: Hero stats are scattered and hard to compare quickly.
  • Choice: Collect once with Python, publish as CSV, explore in a static dashboard.
  • Why it works: Simple setup, fast filtering, and fewer things to maintain.
  • Trade-off: It’s a snapshot, not real-time data.
  • Next improvement: Show missing release years as Unknown, display the real update date, and automate the CSV refresh.

Project note

Spotify Dashboard (Night City Theme)

I wanted my top musics to be presented beautifully, in a unique way. So I drew a scene with Affinity and turned my Spotify data into part of the artwork. Welcome to Night City 🌃🎧.

🔎 Overview

  • Goal: Explore music taste through an artsy, interactive dashboard instead of plain charts.
  • Use cases: See favorite artists, top-ranked tracks, genres, and popularity patterns.
  • Tech stack: React, TypeScript, Vite, D3.js, Python, and Pandas.
  • Data source: Spotify track and artist CSV exports (999 ranked tracks and 439 artists).
  • Main features: Illustrated charts, artist/genre filters, and a Spotify music player.
  • Visual style: My own illustrations drawn in Affinity, a moon made with CSS, and D3.js charts customized to fit the art.
  • Architecture: A static website. No backend needs to be running.

🗺️ How Everything Connects

flowchart TD
    A[Spotify Track CSV] --> C[Python + Pandas]
    B[Spotify Artist CSV] --> C
    C --> D[Merged Spotify CSV]
    D --> E[React + D3.js]
    E --> F[Starry Sky - Scatter Plot]
    E --> G[CSS Moon - Pie Chart]
    E --> H[Building - Bar Chart]
    E --> I[Spotify Embed Player]

The simple version: Spotify data → Python cleanup → React dashboard → interactive charts and music. Easy!

🔁 From CSV to Night Sky

  1. Export: Get Spotify track rankings and artist info as CSV files.
  2. Merge: A small Python + Pandas script joins them using the primary artist’s ID. I made sure the merge keeps the original ranking order of the tracks, because a dashboard about “top songs” with shuffled ranks would be… not great 😅.
  3. Load: React reads the merged CSV when the page opens.
  4. Visualize: D3.js shapes and fine-tunes the charts so they fit the illustrations.
  5. Explore: Click artists, genres, or tracks to filter the view or start playing a song.

📊 What’s in the Dashboard?

Feature What it shows Why it’s useful
Starry-sky scatter plot Up to 50 tracks, plotted against track/artist popularity Spot hits and hidden gems
Moon pie chart Top 5 artists by rank-weighted score See which artists stand out
Building bar chart Top 5 primary genres by rank-weighted score Understand your genre preferences
Interactive filters Selected artist or genre Narrow down the charts
Spotify player Embedded track playback Listen while exploring

🎨 The Artsy Part

This is my favorite bit!

  • Hand-drawn artwork: I drew all the illustrations myself in Affinity so the dashboard would have its own personality.
  • Charts that blend in: I used D3.js to tweak positions, styles, and interactions until the data felt like part of the drawing, not something pasted on top.
Art element Chart Creative idea
Moon (CSS) Pie chart A CSS-made moon turns the artist breakdown into a playful visual.
Starry sky Scatter plot Data points blend into the illustrated night sky like stars.
Building Bar chart The bars fit into the building illustration instead of looking like a standard chart.

The whole idea: it should feel like exploring an illustration, not reading a spreadsheet ✨.

🔭 Okay, But How Do I Read It?

Chart How to read it What it tells you
Starry sky / scatter plot Higher = more popular artist. Right = track is more popular relative to its artist; left = less popular relative to its artist. Find standout tracks, big artists, and underrated songs.
Moon / pie chart A larger slice means the artist contributes more to the ranking score. Which artists dominate your top-ranked songs.
Building / bar chart A taller bar means the genre has a higher combined ranking score. Which music styles appear strongest in your rankings.
Filters Select an artist or genre to focus the charts on matching tracks. Compare a specific artist or style with the wider collection.

Quick example: The #1 track gets a score of 1 / 1 = 1.00, while track #10 gets 1 / 10 = 0.10. So higher-ranked songs carry more weight in the moon and building charts.

Small but important note: These are rank-weighted insights, not actual play counts or listening minutes. The genre chart uses each artist’s first listed genre, and everything reflects the CSV snapshot I used.

🤔 Decisions I Made (and What They Cost)

Area Decision Trade-off
Frontend React + TypeScript Flexible, but adds component code
Charts D3.js Custom visuals, more setup
Art direction My Affinity illustrations + CSS moon Personal look, but more styling work
Data processing Python + Pandas Easy to merge, but refresh is manual
Storage Static CSV No database, but no live data
Playback Spotify Embed Simple integration, relies on Spotify
Hosting Static deployment Easy to run, but updating data needs a new build

💸 Cost & Performance

  • Static hosting: No always-on server or database eating money.
  • Smaller files: Drop unused CSV columns to shrink the download.
  • Chart limits: Show fewer points so things stay smooth.
  • Browser caching: Cache static files so repeat visits load faster.
  • Data refresh: Only rebuild when there’s a new Spotify export.

🔮 What’s Next?

Spoiler: I already started on the “live data” part 👀. There’s an Express + TypeScript backend in the repo with Spotify OAuth login and token refresh, plus a token interceptor on the frontend. It’s not powering the live site yet, but it’s the groundwork for pulling fresh data instead of CSV snapshots.

Other ideas on my list:

Extension Change Benefit
Spotify API Add authenticated data fetching Fresher listening information
More filters Filter by year or popularity Deeper exploration
Listening trends Compare ranking snapshots See changes over time
Database Save past datasets Track long-term preferences
Mobile design Improve responsive charts Better phone experience

📝 Design Journal, in a Nutshell

  • Problem: Normal Spotify rankings are no fun to explore.
  • Solution: Turn them into an artsy dashboard with interactive charts and music playback.
  • Choice: My Affinity artwork + a CSS moon for the scenery, D3.js for chart tweaks, and Python for data prep.
  • Trade-off: Lightweight and easy to host, but not real-time (yet!).
  • Next step: Better data quality and live integration.

💬 Closing

This project taught me that data storytelling can be fun and pretty. Hand-drawn scenes, a bit of CSS, and D3.js turned a simple Spotify dataset into something I actually want to explore.

Put on your headphones and take a little night walk with me 🌙🎶

Project note

Warehouse Management System - Inventory Management for Small Businesses

🔎 Overview

Running a small business means juggling a lot: what’s in stock, what got sold, who still needs an invoice… and usually all of it lives in a few messy spreadsheets 😵‍💫.

WMS puts product records, stock movements, and sales in one system. The web dashboard handles daily management and reporting. The Android app is its sidekick, with barcode scanning and quick stock updates for one specific client whose team works away from a desk.

This was a client project, and it’s now in use by the client, who has taken over ownership and continues development with their own developer 🎉.

The two apps do different jobs but share the same backend and business data. The Android app is a tailored companion, not a second inventory system or a mini copy of the dashboard.

✨ Key Features

🖥️ Web Dashboard

  • Product management: Add, edit, search, and organize items by SKU, variant, category, price, and stock quantity.
  • Stock tracking: Check item activity and stock-in/stock-out history, filter reports by date, and export stock reports as CSV.
  • Sales & invoicing: Build a cart, enter customer and payment details, and create invoices with configurable discounts, taxes, shipping, or other fees.
  • Invoice reports: View transaction details and status, download invoices as PDF, and export invoice records as CSV.
  • Business & team access: Pick a business workspace, invite staff, and manage roles and permissions.

📱 Custom Android Companion

  • Scan or search products: Point the camera at a barcode, or look up an item by part number, then see its details and activity history.
  • Record stock changes: Prepare stock increases, decreases, or new item entries during on-site checks.
  • Review before submitting: Pending changes are saved locally with Room, so staff can edit the list and send everything together once they’re connected.

🗺️ Architecture

The big picture

flowchart LR
    subgraph Clients["Client Applications"]
        direction TB
        Web["Web Dashboard<br/>Next.js + React<br/>Inventory, checkout, reports"]
        Android["Client-specific Android App<br/>Kotlin + CameraX + ML Kit<br/>Scanning and stock checks"]
        Room[("Room Local Database<br/>Pending stock changes")]
        Android <-->|"Save / edit drafts"| Room
    end

    subgraph Backend["Shared Backend - Go + Fiber"]
        direction TB
        API["REST API<br/>JWT authentication + business access"]
        Identity["Users, businesses<br/>and roles"]
        Inventory["Products, categories<br/>and stock history"]
        Sales["Checkout, fees<br/>and invoices"]
        API --> Identity
        API --> Inventory
        API --> Sales
    end

    subgraph Data["Persistent Storage"]
        PostgreSQL[("PostgreSQL<br/>Business records, products,<br/>stock history and invoices")]
    end

    Web <-->|"HTTPS / JSON"| API
    Android <-->|"Lookups / batch updates"| API
    Identity --> PostgreSQL
    Inventory --> PostgreSQL
    Sales --> PostgreSQL

In short: both apps talk to the same REST API instead of touching the database directly. The backend handles login, business-level permissions, and data updates, and PostgreSQL stores the shared records. On Android, Room only holds pending edits. Once submitted, the backend takes care of them.

🖥️ Web frontend

flowchart TB
    Staff["Business owner or staff<br/>Web browser"]

    subgraph Frontend["Web Frontend - Next.js + React"]
        Router["App Router + Middleware<br/>Page navigation and login redirects"]
        Pages["Pages<br/>Inventory, checkout, invoices,<br/>reports, team settings"]
        UI["Reusable UI Components<br/>Forms, tables, cart, exports"]
        Query["TanStack Query<br/>Fetch, cache, update data"]
        Store["Zustand Stores<br/>Cart and pricing adjustments"]
        Services["Service Modules<br/>Auth, tenant, item, invoice"]
        Axios["Axios HTTP Client<br/>JWT access token from cookies"]

        Router --> Pages --> UI
        UI <--> Store
        UI --> Query --> Services --> Axios
    end

    Cookies[("Browser cookies<br/>Access and refresh tokens")]
    API["Shared REST API<br/>Go + Fiber"]

    Staff --> Router
    Cookies -.-> Router
    Cookies -.-> Axios
    Axios <-->|"HTTPS / JSON"| API

I kept screens and reusable components separate from data fetching. TanStack Query handles API data and updates, while Zustand keeps checkout stuff like the cart. Service modules send requests through Axios, which attaches the access token, and middleware takes care of login redirects.

A few more things under the hood that I didn’t mention before 👀:

  • A proper design system. The UI is built with Panda CSS and Park UI (on top of Ark UI), so buttons, inputs, and tables look and behave consistently across around 165 components.
  • Forms that check themselves. Product, checkout, and team forms use React Hook Form + Yup validation, so mistakes get caught before they reach the API.
  • Tables that can keep up. Inventory and invoice lists use TanStack Table for sorting and pagination.
  • Real PDF invoices. Invoices are generated as actual PDF documents with @react-pdf/renderer, and reports export to CSV.

📱 Android app

flowchart TB
    Staff["Staff member<br/>Android device"]

    subgraph Mobile["Custom Android App - Kotlin"]
        Screens["Activities + Fragments<br/>Login, stock check, pending changes"]
        Scanner["CameraX + ML Kit<br/>Barcode scanner"]
        VM["ViewModels + LiveData<br/>UI state and actions"]

        Remote["Remote Repositories<br/>Auth, items, activity history"]
        HTTP["Retrofit + OkHttp<br/>API requests and auth interceptor"]

        Local["LocalProductRepository<br/>Save, edit, delete drafts"]
        DAO["Room DAO"]
        Room[("Room Database<br/>Pending stock changes")]
        Tokens[("DataStore<br/>Access and refresh tokens")]

        Screens --> Scanner
        Scanner -->|"Scanned part number"| Screens
        Screens --> VM
        VM --> Remote --> HTTP
        VM --> Local --> DAO <--> Room
        VM <--> Tokens
        Tokens -.->|"TokenManager"| HTTP
    end

    API["Shared REST API<br/>Go + Fiber"]

    Staff --> Screens
    HTTP <-->|"HTTPS / JSON"| API

The Android app uses ViewModels and repositories to keep screens separate from data handling. CameraX and ML Kit read the barcodes, Retrofit loads product details and submits changes, Room keeps stock-edit drafts until the user reviews and sends them, and DataStore holds the login tokens. Drafts are submitted manually, not synced automatically.

🔨 How It Works

📦 A typical on-site stock check

Picture a staff member checking products in a storage room. Instead of walking back to a computer for every single item (exhausting!), they can scan a barcode, check its record, and prepare a stock adjustment right from their phone. They review all their pending changes before sending them, and once submitted, the updates show up on the web dashboard through the shared backend.

🖥️ Web: inventory to invoice

  1. Sign in and choose a business workspace.
  2. Create or update products, categories, and stock info.
  3. Add products to a cart and enter customer, payment, and pricing details.
  4. Submit the sale through the API, then view invoices or download reports.

📱 Android: scan, review, submit

  1. Scan an item with CameraX + ML Kit, or search by part number.
  2. Fetch its details and activity history from the API.
  3. Record stock increases, decreases, or new items as local Room drafts.
  4. Review the pending list and confirm a batch submission when you’re online.

Quick clarification: the Android app can keep draft changes on the device, but it still needs a connection to look things up and submit updates. It’s not automatic background syncing.

🤔 Decisions We Made (and What They Cost)

Decision Why it fits Trade-off
One REST API for web and Android Both interfaces work with the same business records and rules. Network access is needed for server-side operations.
Room for pending Android changes Staff can stage multiple adjustments and review them before submission. Drafts are only local until submitted; they are not yet reflected on the web.
Barcode scanning with manual lookup Scanning is convenient on-site, while search offers another way to find an item. Scanning depends on barcode quality and camera conditions.
TanStack Query + Zustand on the web Separates server data fetching from temporary UI state such as the checkout cart. Updated records need careful cache refresh and state coordination.

📝 Design Journal: A Client-Specific Decision

  • Problem: Inventory checks happen where the products are, not always at a computer.
  • Choice: Build a focused Android companion for this client’s workflow, instead of squeezing the whole web dashboard onto a phone.
  • Implementation: Camera scanning for lookups, Room for editable drafts, and the existing REST API for shared records and final submissions.
  • Trade-off: The review-and-submit step gives staff control, but pending changes don’t reach the server until they confirm and connect.

UI/UX approach 🎨: I designed the whole user experience and interface for both apps: a web dashboard organized around everyday business tasks, and a focused Android flow for scanning, reviewing, and submitting stock changes.

What I love about this project: one system supports two totally different working situations, managing the business at a desk and checking physical stock on-site, without needing two separate backends.

👩‍💻 My Role & Tech Stack

Me: UI/UX design, web frontend, and Android. I handled all the UI/UX design for both apps, including screen layouts, navigation, and user flows. I also built the Next.js frontend and the client-specific Kotlin Android app, including the inventory and checkout screens, barcode scanning, pending stock-change drafts, and API integration.

My partner: Backend. Built the Go/Fiber REST API, authentication and access control, business logic, and PostgreSQL integration.

Layer Main technologies
Web frontend Next.js, React, TypeScript, TanStack Query, TanStack Table, Zustand, Axios, Panda CSS, Park UI, React Hook Form, Yup, React PDF
Android Kotlin, ViewModel, CameraX, ML Kit, Room, DataStore, Retrofit, Hilt
Backend Go, Fiber, PostgreSQL

🔮 Possible Extensions

Just to be clear, these are ideas for the future, not features that exist today:

  • Cache selected product data on Android, so lookups still work in spots with weak signal.
  • Add clearer retry and conflict-handling flows for when multiple staff members adjust the same stock records.

Thanks for reading! 📦✨

Project note

Writing Mood: Add Vibes to the Blank Page

What if a writing app could change its atmosphere to match the story you’re trying to tell?

Some days, writing feels easy. You open a blank page, start typing, and the words just… flow ✍️.

Other days? Even the blinking cursor feels like it’s judging you 👀.

Okay, a different background won’t magically write your next chapter (I wish!). But the space around your words can make sitting down to write feel more inviting. A quiet, minimal page might help you focus. A darker theme with a little background music might be perfect for a late-night story session.

That’s the idea behind Writing Mood: a writing space where the atmosphere can change, without ever getting in the way of the words.

🔎 The Quick Version

  • The idea: Make writing feel more personal by letting people control their writing environment.
  • The experience: A rich-text editor paired with customizable backgrounds, typography, layout, and sound.
  • The tech: React, TypeScript, Slate, Zustand, and a few libraries for styling and interaction.
  • Where it is now: An early frontend demo. The public part is the home page; the editor and mood tools are frontend prototypes. Accounts, publishing, and cloud syncing aren’t connected yet.

Think of it as a little experiment around one question: can a writing space feel as personal as the writing itself? 💭

🌗 One Story, Two Completely Different Moods

Imagine working on the same story at two different times of day:

🌙 Late-night writing ☀️ Morning editing
Background Deep, muted colors Bright and simple
Text Soft contrast, comfortable size Crisp contrast, easy to scan
Sound Gentle music in the background Silence, please
Layout A cozy, narrower writing area A little more space to review
The vibe Get lost in the story Clean things up and keep moving

The words didn’t change. Only the environment did.

And that’s the interesting part: writers don’t always need more tools. Sometimes they just want to feel comfy using the ones they already have. Some people will love a plain white page forever, and others want a new atmosphere every session. Both are totally valid!

🔨 What’s Inside?

The editor prototype brings two things together: the writing itself and the space around it.

✍️ A place for the words

At the core is a rich-text editor built with Slate, with the writing features you’d expect:

  • Bold, italic, underline, and inline code.
  • Headings, quotes, and numbered or bulleted lists.
  • Text alignment and handy formatting shortcuts.
  • A live word count to keep track of progress.

Nothing wild here, and that’s on purpose. The editor should feel familiar, so you can focus on what you’re writing.

🎨 A little control over the atmosphere

The mood tools let the same workspace feel completely different:

Customization What it changes Why it can be useful
Background A solid color, image, or YouTube video Sets the overall atmosphere
Overlay A tinted or gradient layer Helps text stay readable over busy backgrounds
Typography Font, size, and text color Makes long writing sessions more comfortable
Writing width How wide the text area feels Lets writers choose between cozy and spacious
Music Local audio or a YouTube source Adds an optional soundtrack
Mood presets A saved combination of settings Makes it easier to return to a favorite setup

Picture a Rainy Evening setup 🌧️ with muted colors and soft music, or a Clear Mind setup with a plain background and no sound. (Just to be clear, those are examples of what you could create, not themes that come built into the demo.)

And when the mood changes? Your draft stays exactly the same.

🗺️ How Does It Work?

Writing Mood is built frontend-first. React runs the interface, Slate handles the rich text, and a separate state store keeps track of the visual settings.

flowchart TB
    Visitor["Visitor"] --> Home["Home page - current demo"]

    subgraph Frontend["Writing Mood frontend"]
        Home
        Workspace["Writing workspace - prototype"]
        Editor["Slate rich-text editor"]
        Mood["Mood settings with Zustand"]
        Workspace --> Editor
        Workspace --> Mood
    end

    Editor --> Local[("Browser localStorage")]
    Mood --> Local
    Home -. "future data integration" .-> API["Backend - not connected"]

The key idea: the writing and the mood settings live separately. Changing the font or background never touches the document. It only changes how it looks on screen.

And for a prototype, there’s no need for a server just to remember your favorite color or a draft. The draft is saved in the browser, and so are the customization settings and presets.

📝 A writing session, step by step

  1. Open the writing workspace. The editor checks if there’s a draft saved in this browser.
  2. Start typing. Slate handles the document and its formatting.
  3. Change the mood. Pick a background, adjust the text, or change the writing width.
  4. Keep writing. The look changes, the words don’t.
  5. Come back later. As long as the browser data is still there, your draft and settings come back too.
sequenceDiagram
    participant Writer
    participant Editor as Writing Editor
    participant Browser as Browser Storage
    Writer->>Editor: Type and format text
    Editor->>Browser: Store the draft locally
    Writer->>Editor: Change the background or font
    Editor->>Browser: Remember appearance settings
    Writer->>Editor: Continue the same draft

⚠️ One important thing: browser storage isn’t a cloud backup. It belongs to that browser, and clearing site data can wipe it. Right now, the app is exploring the writing experience, not promising cross-device storage.

🧰 The Tools Behind the Feeling

A customizable writing app sounds simple… until you start putting the pieces together 😅. Text editing, live visual changes, and saved settings all behave differently, so each part needs the right tool.

Technology What it does In plain English
React + TypeScript Builds the interface and manages components Keeps the editor and controls organized
Vite Powers development and frontend builds Helps changes appear quickly during development
Slate Provides the rich-text editing foundation Handles more than a basic text box can
Zustand Manages shared customization state Remembers the chosen look and feel
Emotion CSS Styles UI elements Makes dynamic visual styling easier
Framer Motion Supports animations and transitions Keeps interface changes feeling smooth
React Router Organizes navigation Leaves room for different screens as the app grows

My favorite design choice is how the jobs are split:

  • Slate looks after the words.
  • Zustand looks after the mood.
  • React brings it all together.

Small separation, big difference. A new theme doesn’t mean rebuilding the editor, and a new formatting button doesn’t mean touching the background system.

🤔 The Little Trade-offs That Matter

More customization can be fun, but it can also get distracting. Saving locally is convenient, but limited. And even a gorgeous background can make text harder to read.

Design choice The upside The catch
Customizable atmosphere Makes the workspace feel personal Too many controls can interrupt writing
Rich-text editing Supports more ways to structure ideas More complex than a plain text field
Local browser saving Simple and fast for a prototype Not a replacement for backups or syncing
Images and video backgrounds Offers more creative freedom Can affect readability and performance
Frontend-first development Makes it easier to explore the experience Online accounts and published stories need a backend

The sweet spot: settings are there when you want them, and quietly out of the way when you don’t.

🛋️ Keeping it comfy

  • Readable text comes first. An overlay only helps if the page gets easier to read.
  • Motion and sound should be optional. Your writing space shouldn’t fight for your attention.
  • Simple backgrounds deserve love too. Not everyone wants a video playing behind their words.
  • Draft safety matters. Local saving is great for experimenting, but export and real backups are a must before this becomes anyone’s long-term writing home.

📍 Where Writing Mood Stands Today

Let me be upfront: Writing Mood is a frontend demo, not a finished online writing platform.

The demo you can see is the home page (/), designed around discovering stories. The writing editor, appearance controls, and other screens exist as frontend prototypes, but they’re not a complete public workflow yet. The story feed is designed for an API that isn’t plugged in yet.

So sign-in, publishing, shared story libraries, and syncing across devices aren’t live features right now.

But here’s a little behind-the-scenes peek 👀: I already wrote a product requirements doc for the full version, and the backend is in progress. It’s a FastAPI service with Google sign-in, JWT-based sessions, Redis-backed rate limiting, and data models for stories, story parts (hello, chapters!), and mood presets, with database migrations ready to go. It’s just not wired up to the demo yet.

So the next step is easy to imagine: save documents to an account, organize stories into chapters, and let readers explore published work. For now though, the focus is simpler: what does it feel like to write in a space you can make your own?

💬 Closing

Writing Mood explores that with a mix of practical editing tools and small personal touches. A different background. A comfy font. A quieter layout. Maybe a little music ~

None of those will write the story for you. But if they make the blank page feel a little less blank, I believe that’s a pretty good place to start~!

Project note

Fireworks Visualizer: Making Interactive Fireworks with p5.js

🎆 A Little Backstory

At some point, I realized I’d forgotten almost everything I learned in high-school math 🙃. Sine, cosine, angles, velocity… they all sounded familiar, but actually using them? Totally different story.

I wanted to learn the basics again, just not by staring at a textbook or grinding through a hundred exercises.

So I thought: what if I could see the math in action? Fireworks felt like the perfect excuse. Angles decide where the sparks fly, velocity decides how they move, and gravity pulls them back down. Change one number, and you see the result right away on the screen. Suddenly, math feels more like playing than studying ✨.

That idea became Fireworks Visualizer: a browser playground where clicks and taps make colorful explosions, and you can mess around with the physics behind them. No backend running the show. The browser handles the animation, sound, and controls in real time, all from about 1,900 lines of vanilla JavaScript on top of p5.js.

🔎 Overview

  • What it does: Launch fireworks anywhere on the screen, tweak how they behave, and watch the results instantly.
  • Built with: HTML, CSS, vanilla JavaScript, p5.js, and p5.sound.
  • Key features: Color palettes, ring and solid bursts, recursive explosions, glowing trails, sparkles, smoke, sound, and ready-made presets.
  • Bonus learning tool: A live Trig Inspector that shows the angle, speed, and velocity of a sample particle.
  • Deployment: A static website. No app server, no database for the simulation.

🗺️ How Everything Connects

flowchart TD
    U["Visitor: click or tap"] --> I["Input handler"]
    C["Controls and presets"] --> S["Live simulation settings"]
    I --> E["Fireworks engine - p5.js"]
    S --> E
    E --> P["Shots, particles, sparkles, smoke"]
    P --> L["Off-screen graphics layers"]
    L --> V["Canvas in the browser"]
    E --> M["FPS and entity-load monitor"]
    M --> Q["Adaptive quality"]
    Q --> E
    A["Local image and sound assets"] --> E
    B["Browser localStorage"] <--> C

In plain words: your input → firework physics → visual effects → canvas. There’s also a small feedback loop that keeps an eye on performance and tones down the effects when things get heavy.

Everything that makes a firework runs on your device. The host only needs to serve the HTML, CSS, JavaScript, and media files.

🔨 How a Firework Happens

  1. You click or tap the canvas. The input handler checks how fast you’re tapping and ignores accidental duplicate touch/mouse events.
  2. The firework launches. By default, a glowing shot rises from the bottom of the screen toward where you tapped. You can also turn launch mode off for an instant burst.
  3. Boom, particles! A ring burst spreads particles in evenly spaced directions. A solid burst mixes up the angles and speeds for a fuller look.
  4. Physics takes over. Gravity and drag change each particle’s velocity, while trails, sparkles, optional smoke, and sound make the explosion feel alive.
  5. Everything gets drawn. Separate graphics layers are combined on the canvas, and the Trig Inspector follows one sample particle.

And then there’s Recursive mode 🤯. Particles can create smaller bursts when they fade out, so you get layered explosions instead of one single flash.

🧮 The Math Behind the Magic

Okay, math time! (I promise it’s the fun kind.)

Every burst starts with a speed (v) and an angle (θ). Trigonometry splits them into horizontal and vertical motion:

Where:

  • v = Initial speed
  • θ = Launch angle
  • vx = Horizontal velocity
  • vy = Vertical velocity

On every frame, the engine updates the velocity with gravity and drag, then moves each particle:

Where:

  • x, y = Current particle position
  • vx, vy = Current velocity components
  • Δt = Time elapsed between frames

A few tiny details make a big visual difference:

  • Upward bias gives the first burst a rising arc before gravity pulls it down.
  • Fading trails leave light streaks that disappear naturally.
  • Sine-wave twinkling makes smooth, slightly different sparkle patterns.
  • Recursive scaling makes child explosions smaller, but lets them hang around a bit longer.

The Trig Inspector shows all of this live: a particle’s angle, sine/cosine values, starting velocity, and current position while the animation runs. This is the part that finally made sin and cos “click” for me again 😄.

🎨 Make It Yours

Control What it changes
Colors Warm, cool, rainbow, pastel, neon, monochrome, random, or custom palettes.
Blast type Neat circular rings or more organic, filled explosions.
Particle settings Number of particles, size, trail width, and trail duration.
Blast behavior Spread, lifetime, gravity, and recursive depth (up to two levels).
Visuals and audio Toggle launch shots, smoke, and sound.
Background Upload an image; the selected background is saved in browser storage.
Presets Quickly try styles such as Neon Rings, Golden Shower, Rainbow Burst, or Mega Explosion.

You can change everything while the animation is running, so it’s easy to see how one setting changes the result.

⚡ Keeping It Smooth (aka Surviving the Spam-Clickers)

Here’s a confession: the first version lagged. A lot. Particle effects get expensive fast, especially when someone (me, testing it 🙋‍♀️) taps the screen like crazy. So I did a whole performance pass and wrote down what was actually causing the lag.

The culprits:

  • Unlimited clicks and taps could spawn a ridiculous number of shots in a second.
  • On mobile, touch and mouse events could both fire for one tap, doubling every firework.
  • The main draw loop was filtering arrays and generating random numbers every single frame.
  • Fancy blur effects on the control panels were quietly hurting mobile rendering.

What I changed:

Challenge Approach Trade-off
Too many rapid taps Rate limiting (max 18 inputs per second on desktop, 7 on mobile), duplicate-event protection, and a cap on active shots Some extra taps are intentionally ignored
Too many active effects Budgets for particles, sparkles, and smoke; bursts shrink to fit what’s left Busy scenes cannot grow forever
FPS drops under load Normal → Reduced → Critical quality levels based on smoothed FPS and how many things are on screen Trails and secondary effects become simpler
Mobile hardware limits Mobile starts one quality level lower, with fewer sparkles, shorter trails, and no smoke by default Slightly less detail on smaller devices
Garbage in the hot loop Trimmed collections in place instead of creating new arrays every frame; cached glow values and deterministic twinkle instead of per-frame randomness Code is a bit less “obvious” to read
Inconsistent frame times Time-based motion with a capped frame step Big lag spikes do not produce huge physics jumps

I also gave mobile some extra love 📱: safe-area handling so panels don’t clash with notches, bigger tap targets, 16px form inputs so iOS stops zooming in every time you touch a slider, no accidental double-tap zoom on the canvas, and a presets panel that moves out of the way on small screens.

The big idea is graceful degradation: when things get heavy, the fireworks stay interactive, even if some of the extra sparkle gets dialed down. No cloud GPU, no server-side rendering needed.

🤔 Decisions I Made (and What They Cost)

Decision Why it works What to keep in mind
p5.js + Canvas Flexible, frame-by-frame control over particle animation Rendering and particle lifecycles must be managed manually
Browser-only simulation Simple deployment and immediate interactions Performance depends on the visitor’s device
Separate graphics layers Easier to compose shots, trails, and smoke Additional drawing work uses browser resources
Live controls and presets Beginners can experiment without changing code Many options can make the interface feel busy
Static hosting No backend infrastructure for animation logic Bandwidth and static hosting costs still depend on traffic

💬 Closing

Fireworks Visualizer showed me how far a browser can go with just a few familiar tools. A little trigonometry gives direction, simple physics adds motion, and careful rendering turns hundreds of tiny dots into something that feels alive.

But the bigger lesson for me wasn’t really about fireworks. It’s that math gets way easier to reconnect with when you can poke at it and see what happens. And you can build something interactive, customizable, and smooth without overcomplicating the architecture.

Now go make some explosions! 🎇

Project note

Kaleidoscope Eyes - An Interactive Rive & WebGL Experience

Some websites are meant to be read. Lost in the Star is meant to be played around (lol).

At the center is a girl I drew myself in Affinity. Then I thought, what if she could actually move? So I brought her to life with Rive animation and some real-time visual effects. Click, zoom, and watch the little details come alive 👀.

Fun fact: the eyes were inspired by the Sharingan from Naruto. But I didn’t want to just copy that iconic pattern, so I gave it a twist. Her eyes turn into colorful, ever-changing kaleidoscopes instead 🌈.

🔎 Overview

Here’s the quick version:

  • Goal: Make an immersive, interactive artwork instead of a “normal” website.
  • Main idea: Bring my hand-drawn character to life with Rive animation and moving kaleidoscope patterns inside her eyes.
  • Interactions: Click to make her blink and reshuffle the patterns, zoom in for a closer look, or pause the motion.
  • Tools: Affinity for the illustration, plus Rive, Three.js, WebGL, JavaScript, CSS, and Vite.
  • Deployment: A static site on Netlify. No backend, no database, no drama.

🗺️ How the Pieces Fit Together

flowchart TD
    A[Visitor] --> B[Browser and UI Events]
    B --> C[Rive Canvas: Character Animation]
    B --> D[Three.js: Animated Kaleidoscope]
    D --> E[Two WebGL Eye Canvases]
    C --> F[Canvas Position and Size]
    B --> G[Zoom and Resize Events]
    G --> H[Eye Alignment Logic]
    F --> H
    H --> E

The idea is actually simple: Rive animates the character, Three.js creates the shifting eye patterns, and JavaScript keeps both layers lined up so they feel like one scene, not two things awkwardly stacked on top of each other.

🔨 How It Works

  1. The scene loads. You get a dark illustrated background, and the Rive character animation starts playing.
  2. The eyes get their magic. Three.js animates 3D torus-knot shapes and turns their rendered texture into a repeating kaleidoscope pattern.
  3. Layers stack up. Two WebGL canvases sit right over her eye areas and show that pattern.
  4. She reacts when you click. Clicking her triggers a Rive blink and a fresh arrangement of shapes. There’s also a little cursor ripple for extra feedback ✨.
  5. Zoom without breaking anything. The Zoom button cycles through three views (normal, closer, and closest) before resetting. Her eye positions get recalculated every time you zoom or resize the window, so the kaleidoscopes never slide off her face 😅.

Oh, and there’s a live control panel too! You can play with speed, color, complexity, and symmetry. Press Space to pause or resume the kaleidoscope motion.

Credit where it’s due 🙏: the kaleidoscope effect builds on ThreeJS_Kaleidoscope by colordodge (MIT License). My part was squeezing it into two tiny eyes and making it play nicely with a Rive character.

🐛 The Case of the Drifting Eyes

Here’s a bug that made me laugh (after it stopped making me cry).

In the first version, I placed the eye canvases with hardcoded pixel values: fixed widths, fixed top offsets, and calc(50% +/- something) for each zoom level. It looked perfect… on my screen. Resize the window, and the kaleidoscopes slowly wandered off her face 👀💨.

The problem? The Rive canvas scales and shifts with the window, but my eye positions were tied to one specific screen size.

The fix was to stop thinking in pixels and start thinking in proportions of the canvas. Now the eyes are described as ratios of the rendered Rive canvas (for example, the left eye sits at about 43.85% across and 35.5% down, with a diameter of about 11.8% of the canvas width). Every time the window resizes, the zoom changes, or the WebGL renderer updates, the positions get recalculated from the live canvas size. I also animated the horizontal movement so zooming feels smooth instead of jumpy.

I checked it in the default view, with a resized window, and at different zoom levels, and the eyes finally stayed put. Bonus: if I ever want to nudge them for art direction, I just tweak four numbers.

🧰 The Tools Behind It

Technology What it does
Affinity Where I drew the original girl illustration.
Rive Plays the character animation and handles the blink interaction.
Three.js + WebGL Renders the animated kaleidoscope visuals in the eyes.
JavaScript + CSS Connects clicks, zoom states, canvas positioning, cursor effects, and layout.
Vite Builds and serves the frontend during development.
Netlify Hosts the finished static website.

🤔 Decisions I Made (and What They Cost)

Every choice comes with a “but”. Here’s mine:

Decision Why it works Trade-off
Separate Rive and WebGL layers Each tool does what it does best: character animation and real-time graphics. Their positions have to stay in sync.
Canvas-relative eye positioning The effects follow the character when the screen resizes or zoom changes. A different character design may need new eye coordinates.
Two WebGL eye canvases Each eye gets its own carefully placed visual layer. Extra rendering work can be demanding on slower devices.
Static, browser-only architecture Easy to deploy, with no server-side logic to maintain. Animation performance depends on the visitor’s device.

⚡ Performance & What I’d Improve

The effects animate nonstop, so the real worry here isn’t server cost. It’s keeping things smooth in your browser.

  • Go easier on the GPU: Simplify the effects or lower rendering demands on less powerful devices.
  • Slim down assets: The background image is pretty big, so compressing it would make the first load faster.
  • Make motion optional: Add a reduced-motion mode and improve touch and keyboard accessibility.

💬 Closing

Lost in the Star is my little proof that a simple page can feel like a living illustration. And the part I’m proudest of isn’t just the animation or the WebGL effects. It’s getting two totally different rendering systems to move together like they were always one piece.

Go say hi to her and make her blink a few times :3

Project note

UI/UX Case Study: Petster  -  The Ultimate Pet Companion

🔎 Overview

Petster is a one-stop mobile platform that **helps pet owners to connect with pet care service providers.**It provides a variety of services, from online vet consultation, pet clinic, vaccine, neuter/spay, pet hotel, and pet salon. Users can find nearby available services with the details, do their own comparisons, and do online reservations.

This project is a personal initiative to improve my design skills. It was done in 4 months. Since it’s an individual project and I did the process by myself, here are the roles I play to get this case study finished.

  1. UX Researcher: conducting user research to identify opportunities; analyzing data collected; gathering insights about users’ behaviors, needs, and pain points, through observation and feedback.
  2. UX Designer: understand users through research results, develop wireframes and prototypes, conduct testing
  3. UI Designer: create the visual elements, and develop high-fidelity screen designs through which a user will move
  4. UX Writer: writes the microcopy, creating clear copy to help users make the right decision about what to do next

🏃‍♀ ️The Process

As the guide for problem-solving, I adapt the famousdesign thinking processwhich can be elaborated into five phases: empathize, define, ideate, prototype, and test.

I did the breakdown of the process into three main checkpoints and documented each output I got.

List of content

List of content

👀 Let’s Dive into the Problem

A Personal Story From Me

There are a lot of stray cats live around my house. They visit me pretty much regularly because I often give them food. That’s why I get to know the time when one of them came with terrible swollen paw, and she limped as she walked😢.

There are also a lot of new kitten being born every months, without the guarantee that they can have enough food and safe place to stay on bad weather. Overpopulation is a nightmare.

I wish I could bring the sick cats to vet, **neuter (sterilize)**the mother cats, and call the experienced ones to cleanthem — especially that white-furred cat who now has turned into dark gray🙂. Too bad, I live in a small city where the access to veterinary is limited.

That’s how the idea of Petster first popped into my mind. Just like how delivering foods and ordering drivers could be so easy, I assume it would be very helpful for pet owners to have a platform where they could find and visit nearby service they need for their pets🐾.

Well, Personal Assumption isn’t Enough

To find a sufficient foundation for this study, I started by doing both individual research and target user research.

The objective of this research isto understand pet owner’s behavior on taking care of their pets and their mental model on pet-related online platforms.

👩‍🔬Individual Research

There’s a ton of helpful information available to be explored online. I tried to collect and analyze them by myself.

Observation on Social Media

Just by searching certain words, it’s easier than ever to read people’s discussions on a topic. Let’s see how the magic of “keyword” works✨.

  • It’s very common to see pet owners looking for subsidized spay and neuter programs. Subsidy program usually provides low-cost service (or even free!) for pet owners.

Findings from Twitter

Findings from Twitter

  • Information about subsidy programs usually being spread through social media and word-of-mouth recommendations. Most of the programs offer affordable vaccines and neuters for cats and dogs.

Subsidy program posters from Twitter, Facebook, Instagram, and WhatsApp.

Subsidy program posters from Twitter, Facebook, Instagram, and WhatsApp.

  • Veterinary care and animal clinics are available in most areas of Indonesia, the price is also affordable. The problem is that the doctor isn’t always available in the clinic, even during open hours.
  • On the contrary, in busy areas, pet owners have to wait in hours of queues only for a 5-minute-long vaccine shot for their cats.

People on various platforms complaining about veterinary

People on various platforms complaining about veterinary

  • Pet owners rely on social media to find pet care with specific facilities and services.

Other findings from Twitter and Facebook.

Other findings from Twitter and Facebook.

Similar Platforms Analysis

Studying the existing platforms helped me to collect insights on how I can position my product better in this field. Even with the same initial idea, each execution process could come up with its own unique solution.

I tried to check out platforms that might connect with my agenda and execute my idea in such other ways.

  • Petshop Indonesia

SWOT analysis of Petshop Indonesia

SWOT analysis of Petshop Indonesia

  • Satwagia

SWOT analysis of Satwagia

SWOT analysis of Satwagia

  • Halodoc

SWOT analysis of Halodoc

SWOT analysis of Halodoc

👨‍👨‍👧‍👧Target User Research

I created a questionnairefor 35 respondents, and choose 3 of them to continue intothe in-depth interview.

An in-depth interviewis a valuable tool for gaining an in-depth understanding of users’ needs, preferences, and motivations. Here are the main questions I asked to them.

  • Can you tell me what service you usually give to your pet?
  • How do you usually access that services?
  • Why do you choose them to take care of your pet?
  • What do you expect from veterinary care and pet shop?
  • What are the hardships you face the most as a pet owner?

I processed all of the results into clusters and finish them with key insights served in a simple affinity map. This method helps to identify patterns and trends in user feedback.

Research result in affinity map

Research result in affinity map

📜Further User Exploration

Based on my dialogue in the previous interview, I have identified two distinct types of pet owners. Both of them were found to have different wants and needs when it comes to the service for their beloved pets.

To better understand each group, let’s take a closer look at what makes them unique.

Persona and empathy map #1, a cost-driven pet owner

Persona and empathy map #1, a cost-driven pet owner

Persona and empathy map #2, a quality-oriented pet owner

Persona and empathy map #2, a quality-oriented pet owner

**Pet owners like Vania have low budget to take care of her pets.**They would likely prioritize the essential needs of their pets. She might look for discounts and free resources when it comes to food and medical care.

On the other hand, Raka will make sure that their health and well-being are top priorities. He will ensure that they have access to quality veterinary care, a balanced diet, regular exercise, and premium pet products.

Afterward, based on my comprehension of them so far, I can write an objective to focus this study on the target user’s goals. Here it is!

📌As a pet owner, I want to be able to easily find the best pet service provider that meets my budget and needs, so that I can provide my pet with the expected quality care.

🧠Brainstorm the Potential Solutions

To understand the target user’s point of view better, I tried to identify the steps that they take in order to complete their goal of reaching a pet service provider.

Understanding the pet owner’s journey and experience from start to finish could help me to find areas where improvements need to be made.

Looking closer at what a pet owner going through🔎

Looking closer at what a pet owner going through🔎

I created Eisenhower Matrix to help organizing the list of pain points into categories based on urgency and importance. I’ll focus my attention on those that fell within the important-urgent quadrant.

Time to spark creative thinking

How Might We questions are a great way to identify potential solutions, explore all angles of an issue, and set boundaries on what needs to be done.

I already have one main question: How might we help pet owners to easily find the best pet service provider that meets their budget and needs?

I can divide it into multiple smaller questions to address each of the issues that I observed during my investigation.

How might I? How might we?

How might I? How might we?

Next, I came up with a bunch of answers. It’s important to avoid getting stuck on certain alternatives and it’s okay to just throw everything on the table. Remember that you can always say no to any possibility later.

Since I worked on this alone, I try to involve additional brains by bouncing my idea off of my friends and family members to see their responses and suggestion.

Some of the potential solutions I had listed

Some of the potential solutions I had listed

💡Determine the Solution

I managed to list 56 potential solutions. That’s. A. Lot. There’s no way I could execute everything in one go.

I started to narrow down which ones would be feasible to implement as the answers for the issues that were identified. To do this, Decision Matrixreally comes in handy.

I did my decision matrix on a spreadsheet

I did my decision matrix on a spreadsheet

By assigning numerical values to each relevant factor to the solution, it can be easier to identify which option has the highest overall benefit or score.

After I obtained filtered ideas, I then listed the requirements I need.

The final result of possible solution brainstorming✨

The final result of possible solution brainstorming✨

To see the whole process, feel free to go tothis spreadsheet (click me!).

Drawing ideas from the above list, this is how I imagine my user would use the app😄.

Storyboard could be a helpful guide for the next step when I developed my sitemap and user flow. Pic source: canva, freepik, flaticon

Storyboard could be a helpful guide for the next step when I developed my sitemap and user flow. Pic source: canva, freepik, flaticon

One step closer to the actual product

As the starting point of working on the solution, I constructed a sitemap. It provides a bird’s eye view of the entire site and how all its components relate and navigate to each other.

Since I decided to build a mobile app design, I started crafting the sitemap from the bottom navigation menu by defining which pages users would visit the most and what I want them to discover.

The birdview of whole app navigation

The birdview of whole app navigation

Alongside with sitemap, I created user flows to identify how a user moves through the application.

🔨Let’s Get to the Prototype Design

Start with lo-fi wireframe

I created Crazy 8 models for important screens that required a great deal of thought. These screens included the home screen and service providers (location) list.

**For home screen, I want to give users a clear idea of key features that Petster can do.**After gathering the ideas, I developed an alternative solution that incorporated all the significant pros while minimizing their cons.

Crazy 8 — Home

Crazy 8 — Home

I did pretty much the same steps for service provider (location) list page. For this screen, I want to allow users easily find what they are looking for and compare their options.

Crazy 8 — Service provider (location) list

Crazy 8 — Service provider (location) list

Next, I made some paper sketching to explore potential layouts. I ensure that the flow is reasonable and doesn’t leave fatal mistakes because revising the high-fidelity design later will cost more effort.

Paper wireframe

Paper wireframe

Product Persona

I used product persona as a concept to help me visualize and focus how Petster should be visually designed**. With this, I had a clear goal of how the app should look and feel.**

Product persona of Petster

Product persona of Petster

Design System

I established a set of guidelines that outlined typography styles, colors, spacing and other elements which were used in all UI components of Petster

  • Logo

My goal was to create a logo that speaks the branding of Petster. I sketched out the rough version of my ideas and did some tweakings until I’m satisfied with how it looks.

The logo crafting process

The logo crafting process

  • Color

Beside the orange as primary color, I definitely need neutral colors to create contrast between elements on the page, as well as providing an easy-on-the-eyes backdrop for text or other visuals.

To make the neutral color blends better with the primary color, I made shades of black with a hint of orange accent in them.

How I chose neutral color palletes

How I chose neutral color palletes

  • Banner

Since orange — that I use for primary color — is also conventionally associated with “warning” alert, I use the secondary color — blue — for “neutral” information.

  • Layout and Spacing

I refer to Material Design to define the layouts and spacings. **On mobile, at a breakpoint of 360 dp, layout grid uses 4 columns.**For the spacings, I use icrements of 8dp and 4dp as the base grid unit.

  • Others

Check out the full design system below (or justclick me!).

And finally, the high-fidelity design

Here I present the screen design together with the flow. Note that there are three types of booking flow because different services somehow work better in different screen design or flow.

Booking flow screens for vaccine, neuter and spay, pet salon, and pet clinic.

Booking flow screens for vaccine, neuter and spay, pet salon, and pet clinic.

Booking flow screens for pet hotel and pet sitter

Booking flow screens for pet hotel and pet sitter

Booking flow for online vet chat

Booking flow for online vet chat

Save pet data for reuse, also manage their treatment schedule

Save pet data for reuse, also manage their treatment schedule

See what currently going on, scheduled, finished, or cancelled

See what currently going on, scheduled, finished, or cancelled

Messaging

Messaging

Now, let’s examine my attempt to achieve the above solution

Here’s the process of how I came up with above designs.

Home screen

Home screen

Service provider list

Service provider list

Service provider detail

Service provider detail

Catalog

Catalog

Pet profile

Pet profile

Calendar screen

Calendar screen

UX Writing: Language as a design tool

Language also affect what does the design look like, what does it feel like, the mood and the tone, in the same way that visuals do.

Writing highlight

Writing highlight

Wireflow and annotations

Together with the prototypes, wireflows provide effective way to communicate with team membersduring the product development process, this includes helping engineer when developing the app.

Create wireflow and annotation in Figma

Create wireflow and annotation in Figma

💬Get Feedback from the Potential Users

In this stage, I conducted remote usability testing with Maze and also collected feedback using **System Usability Score (SUS)**to gain insight from the target user — pet owners.

1. Usability Testing with Maze Tool

I did the remote usability testing with 5 participants thanks to the help of Google Meets and Maze. I compiled their response into a feedback grid.

After that, I did some improvements and test them to different 5 participants. Find the 10 scenarios and the detailed iterations below.

Scenario 1: Make a booking

Scenario 1: Make a booking

Scenario 2: Find FAQ page

Scenario 2: Find FAQ page

Scenario 3: Chat a service provider

Scenario 3: Chat a service provider

Scenario 4: Find subsidized service

Scenario 4: Find subsidized service

Scenario 5: See booking history

Scenario 5: See booking history

Scenario 6: See archived (closed) chatroom

Scenario 6: See archived (closed) chatroom

Scenario 7: See your pet data

Scenario 7: See your pet data

Scenario 8: Add new pet data

Scenario 8: Add new pet data

Scenario 9: Go to schedule calendar

Scenario 9: Go to schedule calendar

Scenario 10: Add new event to calendar

Scenario 10: Add new event to calendar

Although some improvement could still be done, participants in second iteration performed much better than the first ones, and it shows from the usability score.

2. System Usability Score (SUS)

I collected questionnaire feedback from 5 second-iteration participants based on SUS method.

The preview of how I calculate the SUS

The preview of how I calculate the SUS

The final score is 75 which considered a good score, but could improve.

The final SUS

The final SUS

This score is a quick judgment about app usability, but it’s unable to provide accurate feedback about specific area of weakness. This is how usability testing with Maze on previous could help to improve the design.

Based on the summary above, I found out that:

  • How I prepare the prototypes and mission could really affect the score. Sometimes the bad score isn’t caused by the design, but by prototype interaction or the mission description.
  • It’s important to keep the participants actively speak up their thoughts verbally on each step they take. In that way, I could observe the smallest detail in their response that they don’t even realize themshelves.
  • The participants love the final app concept. It would especially be helpful for pet owners who has to manage a lot of pet.

The final prototype

Try it out from the embeded prototype on Figma (just click me!).

🔮Future Scope

In the future, Petster can extend the service for online pet shop too because it’ll probably helpful for pet owner to shop their needs, such as food, litter sand, treats, etc. Subscription model is also worth to study as well.

Closing

And that’s a wrap. Thank you for reading. I really enjoy the process of creating this study case, I hope ya’ll enjoy it too!

Contact📩: chrislinlin.cl@gmail.com

06 / Nobody scrolls to the footer, so...

Silly mode lab

Rotate
100%