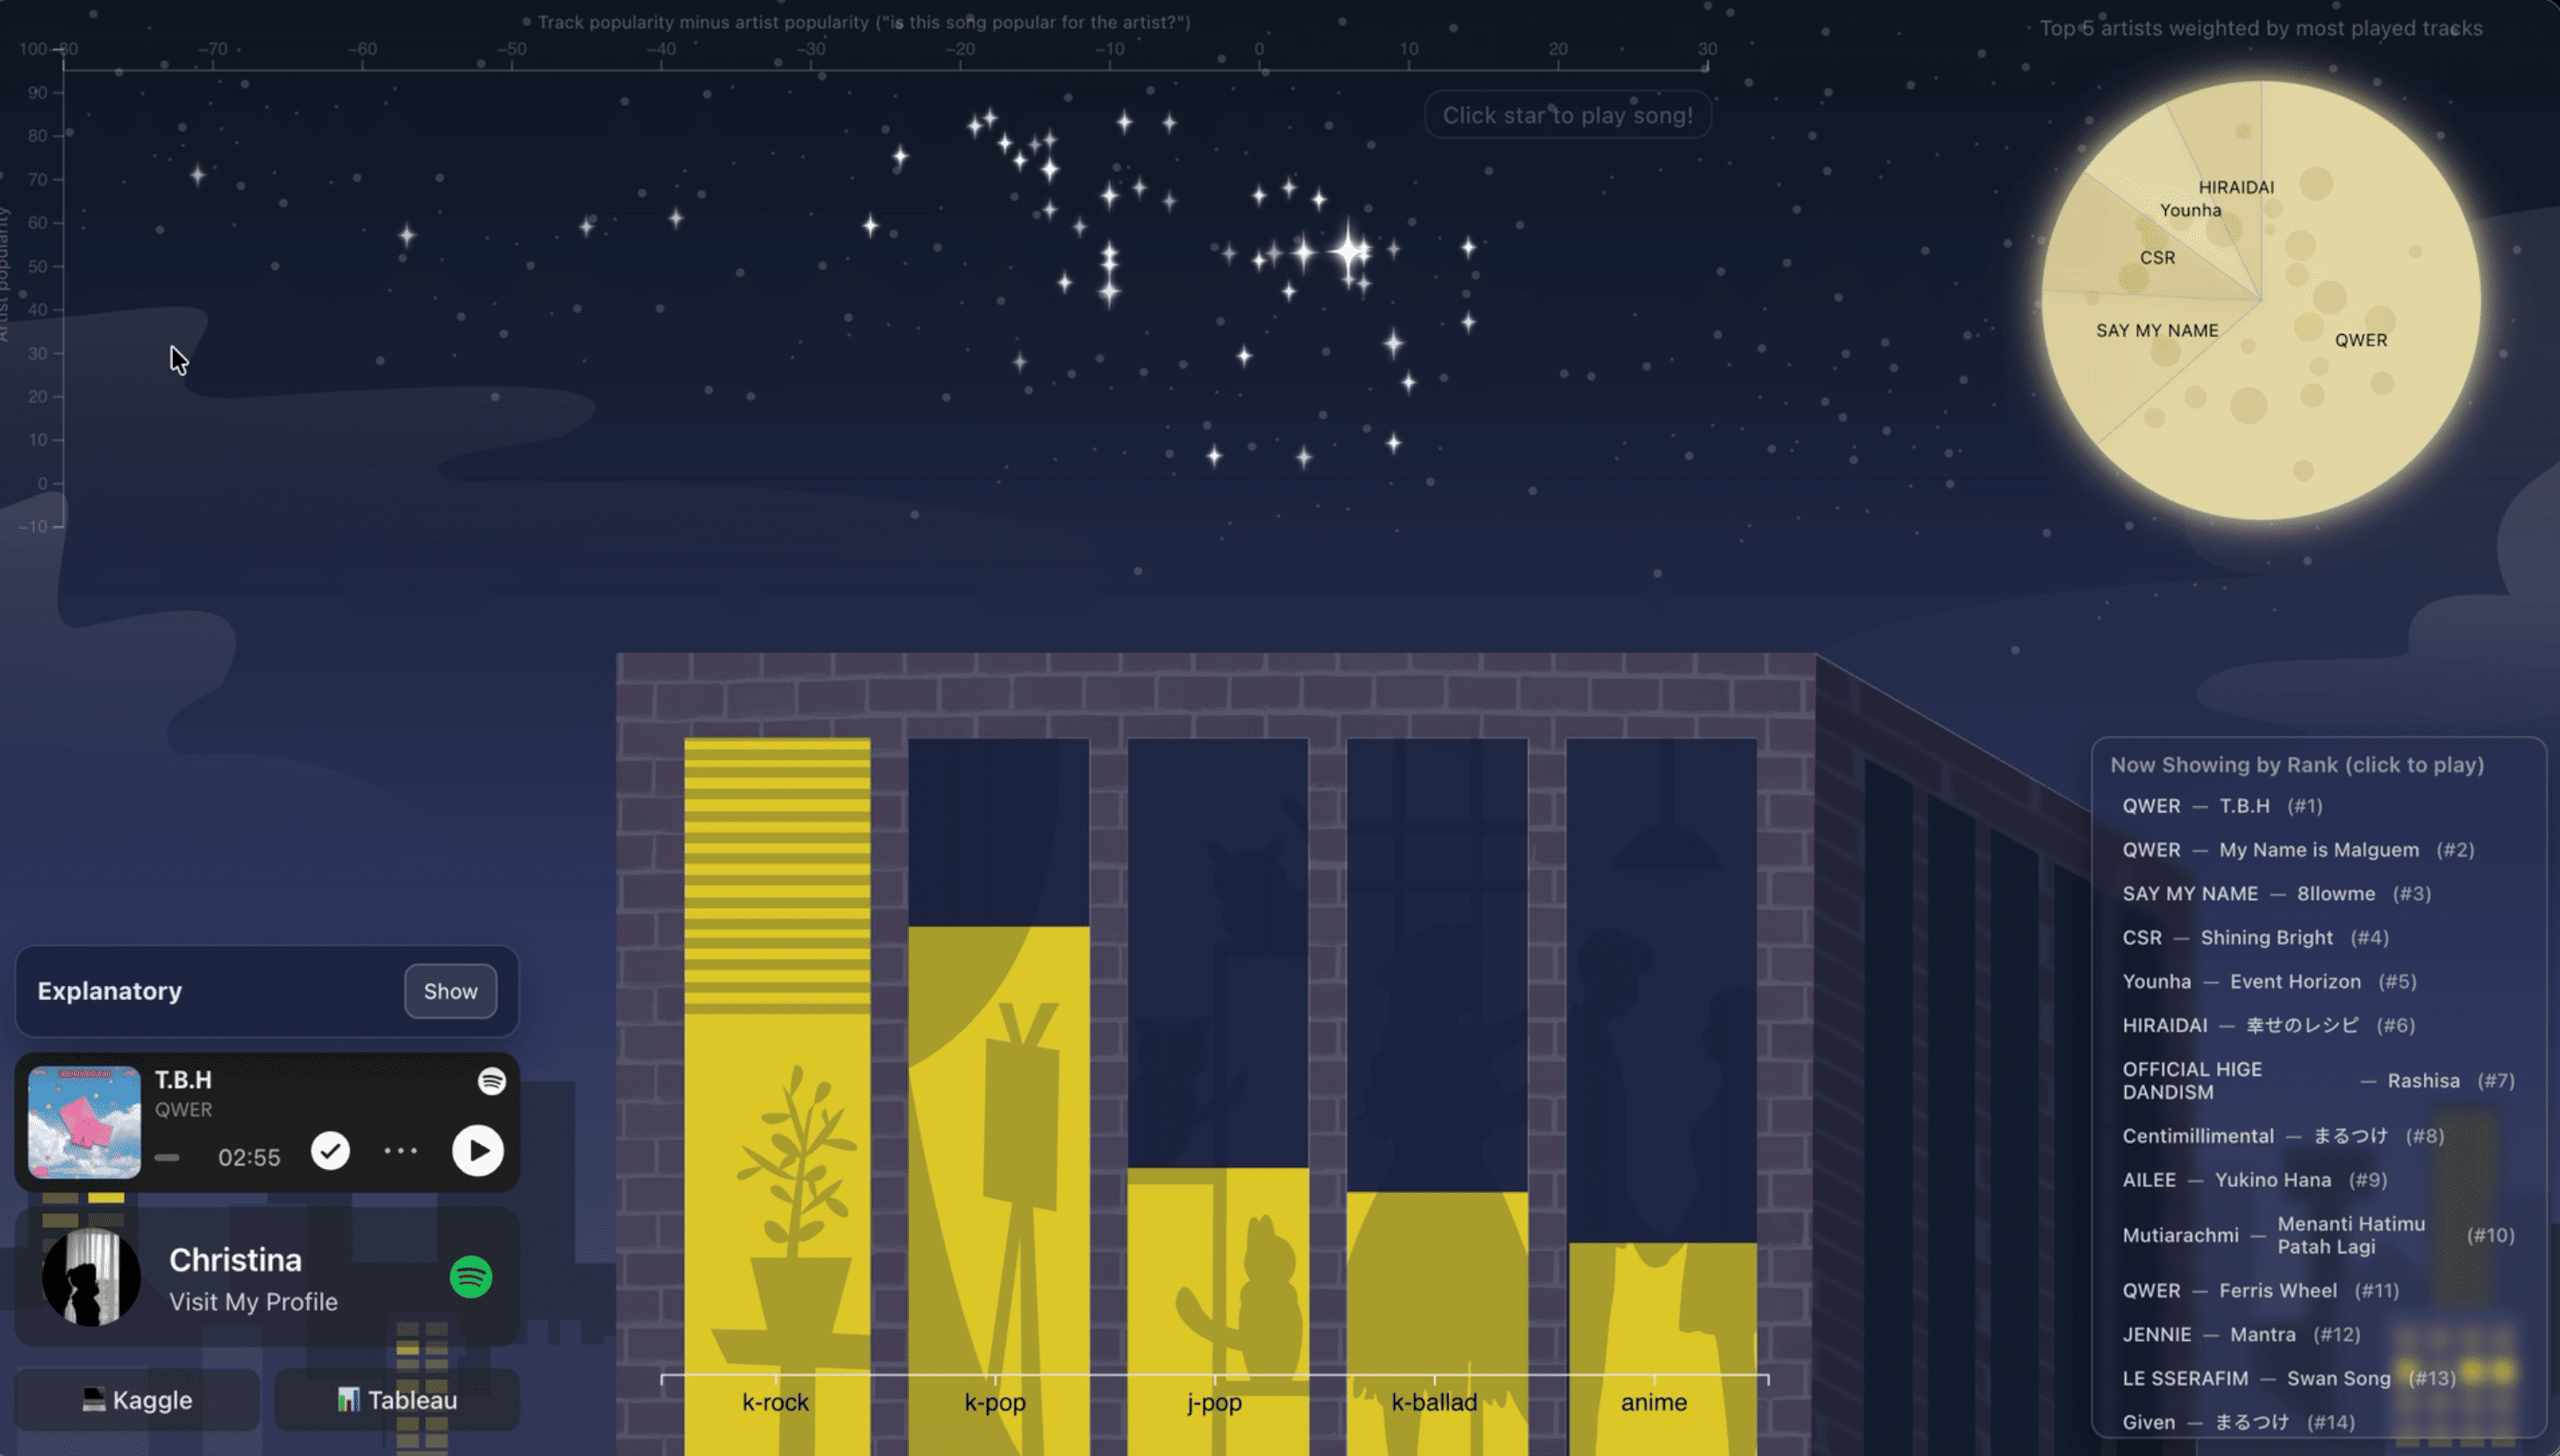
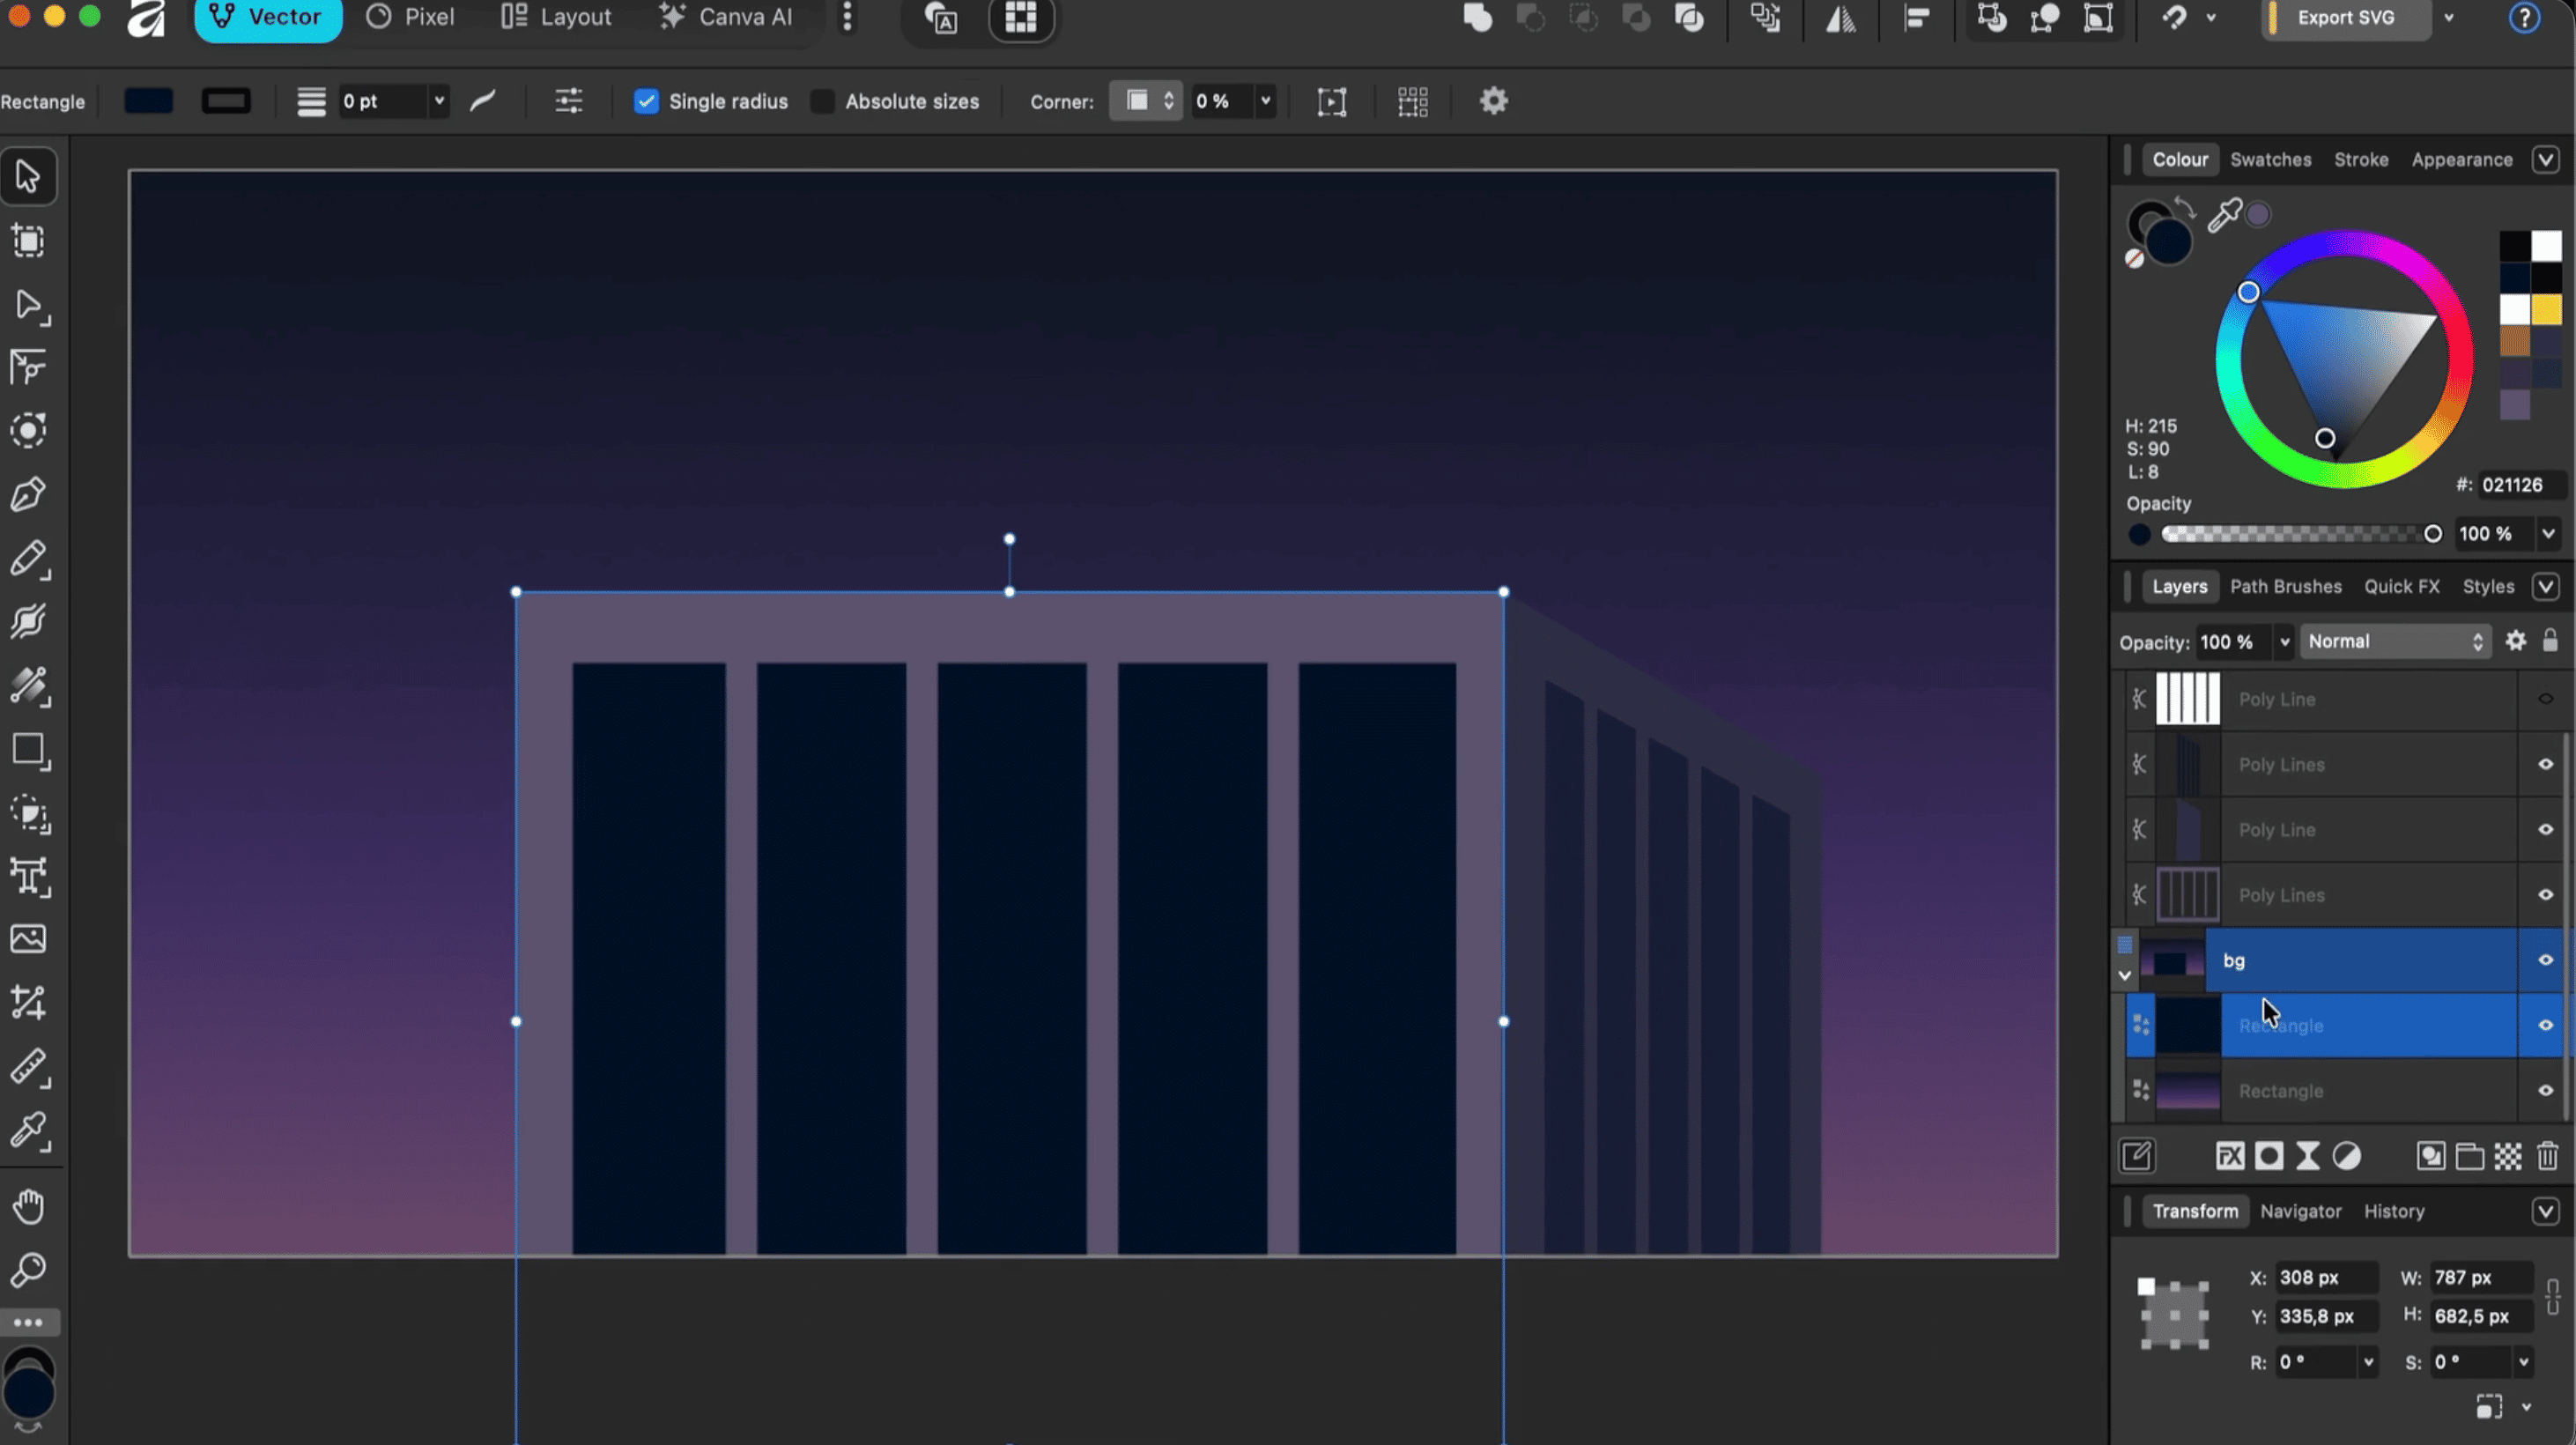
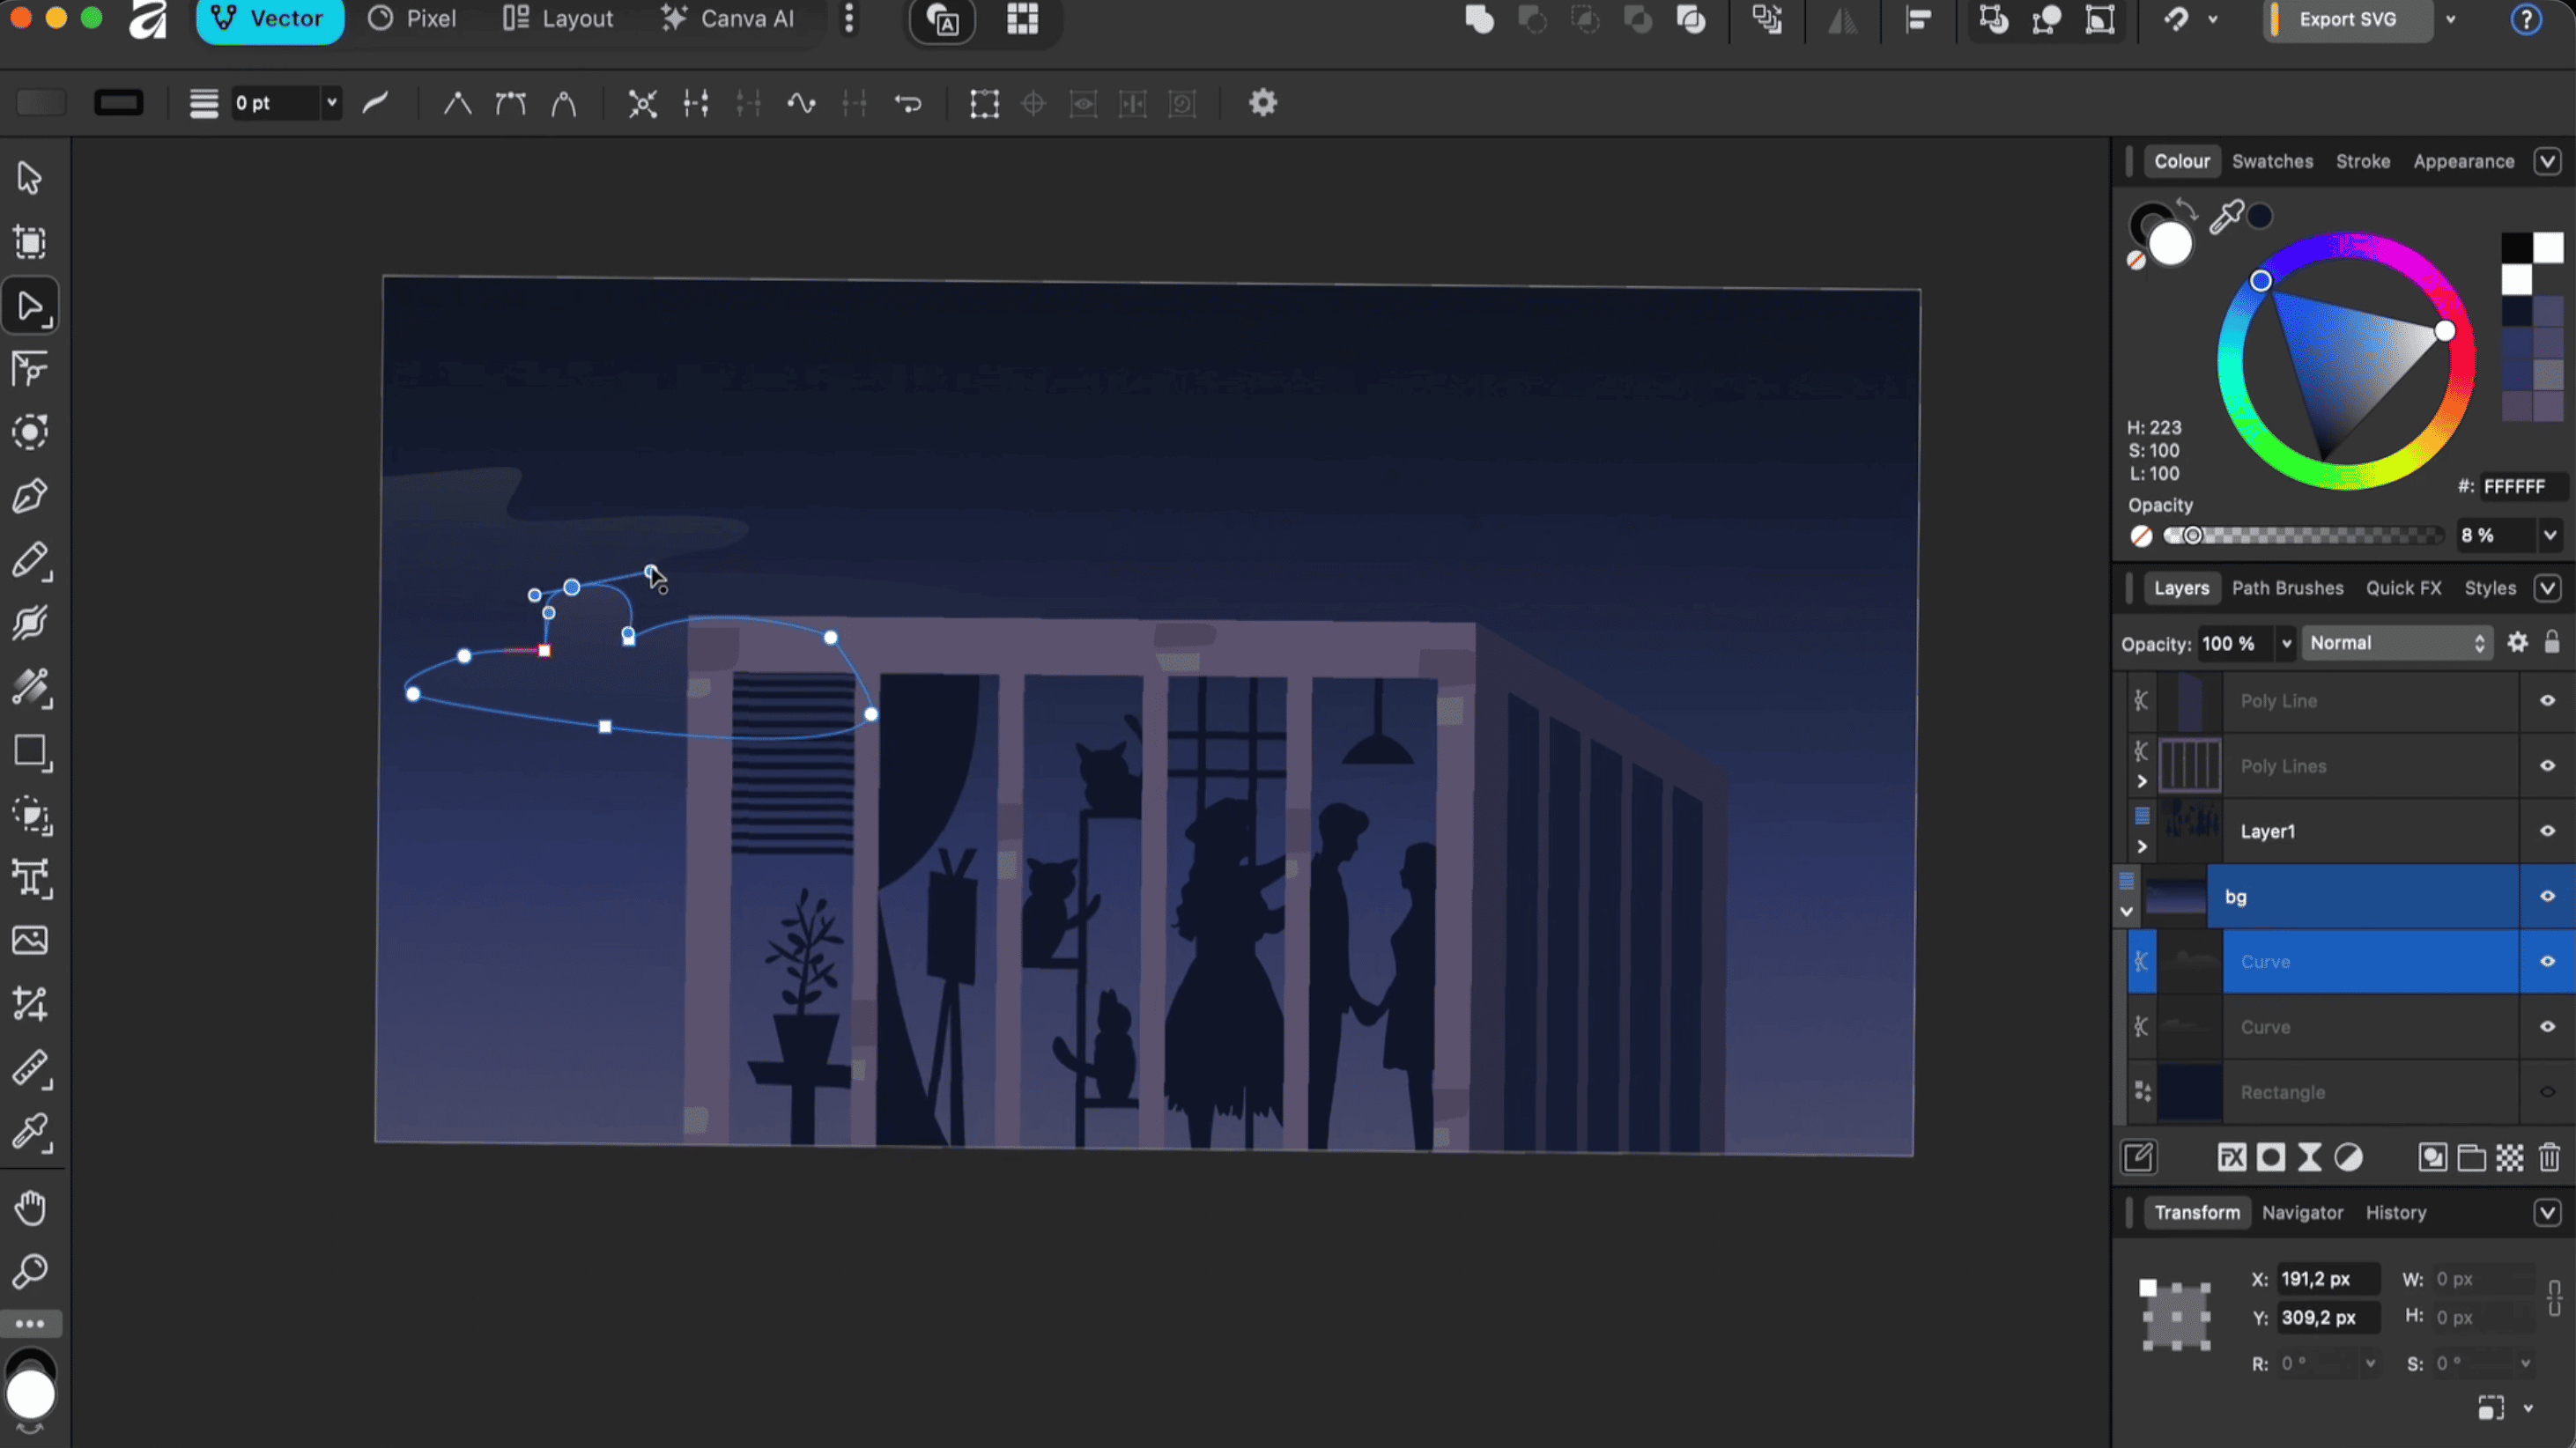
I wanted my top musics to be presented beautifully, in a unique way. So I drew a scene with Affinity and turned my Spotify data into part of the artwork. Welcome to Night City 🌃🎧.
🔎 Overview
- Goal: Explore music taste through an artsy, interactive dashboard instead of plain charts.
- Use cases: See favorite artists, top-ranked tracks, genres, and popularity patterns.
- Tech stack: React, TypeScript, Vite, D3.js, Python, and Pandas.
- Data source: Spotify track and artist CSV exports (999 ranked tracks and 439 artists).
- Main features: Illustrated charts, artist/genre filters, and a Spotify music player.
- Visual style: My own illustrations drawn in Affinity, a moon made with CSS, and D3.js charts customized to fit the art.
- Architecture: A static website. No backend needs to be running.
🗺️ How Everything Connects
flowchart TD
    A[Spotify Track CSV] --> C[Python + Pandas]
    B[Spotify Artist CSV] --> C
    C --> D[Merged Spotify CSV]
    D --> E[React + D3.js]
    E --> F[Starry Sky - Scatter Plot]
    E --> G[CSS Moon - Pie Chart]
    E --> H[Building - Bar Chart]
    E --> I[Spotify Embed Player]
The simple version: Spotify data → Python cleanup → React dashboard → interactive charts and music. Easy!
🔁 From CSV to Night Sky
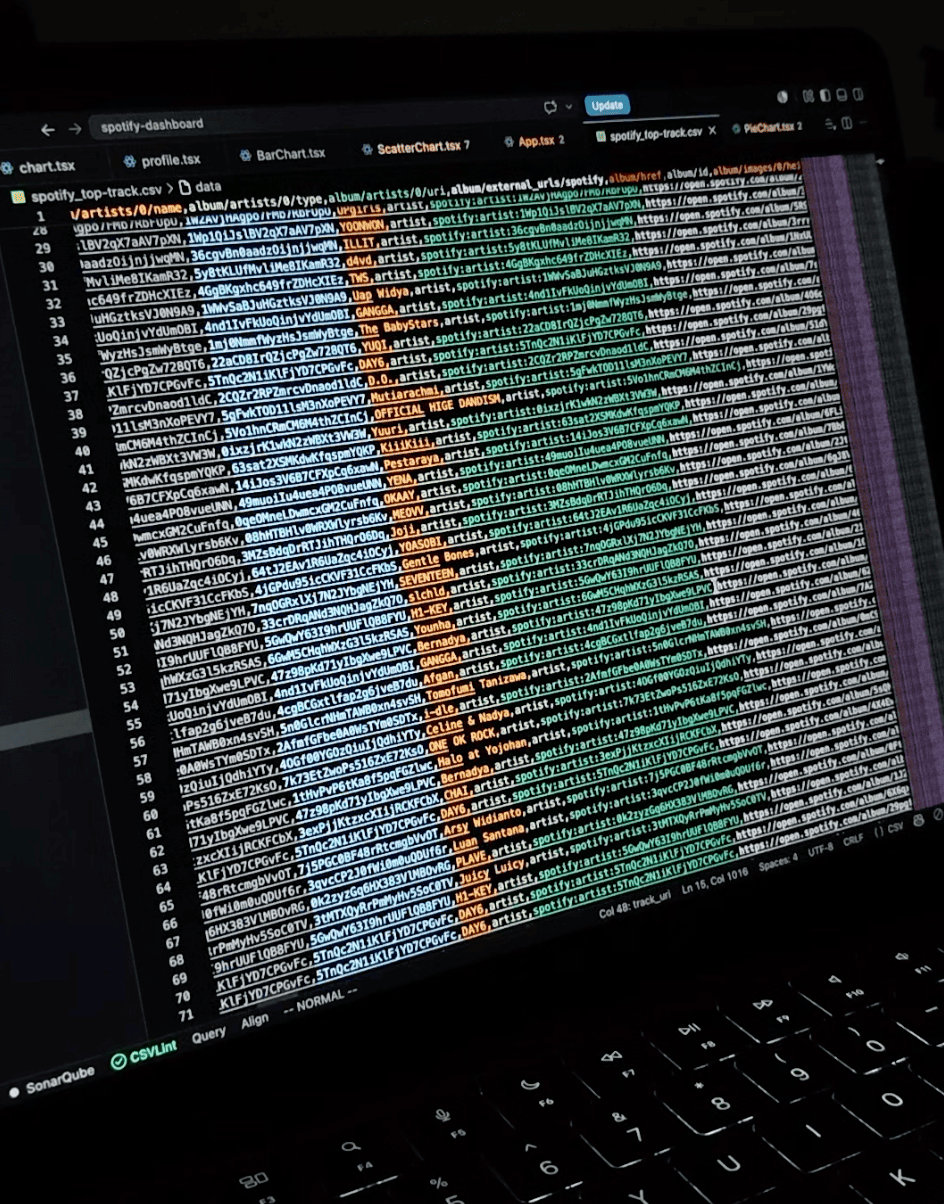
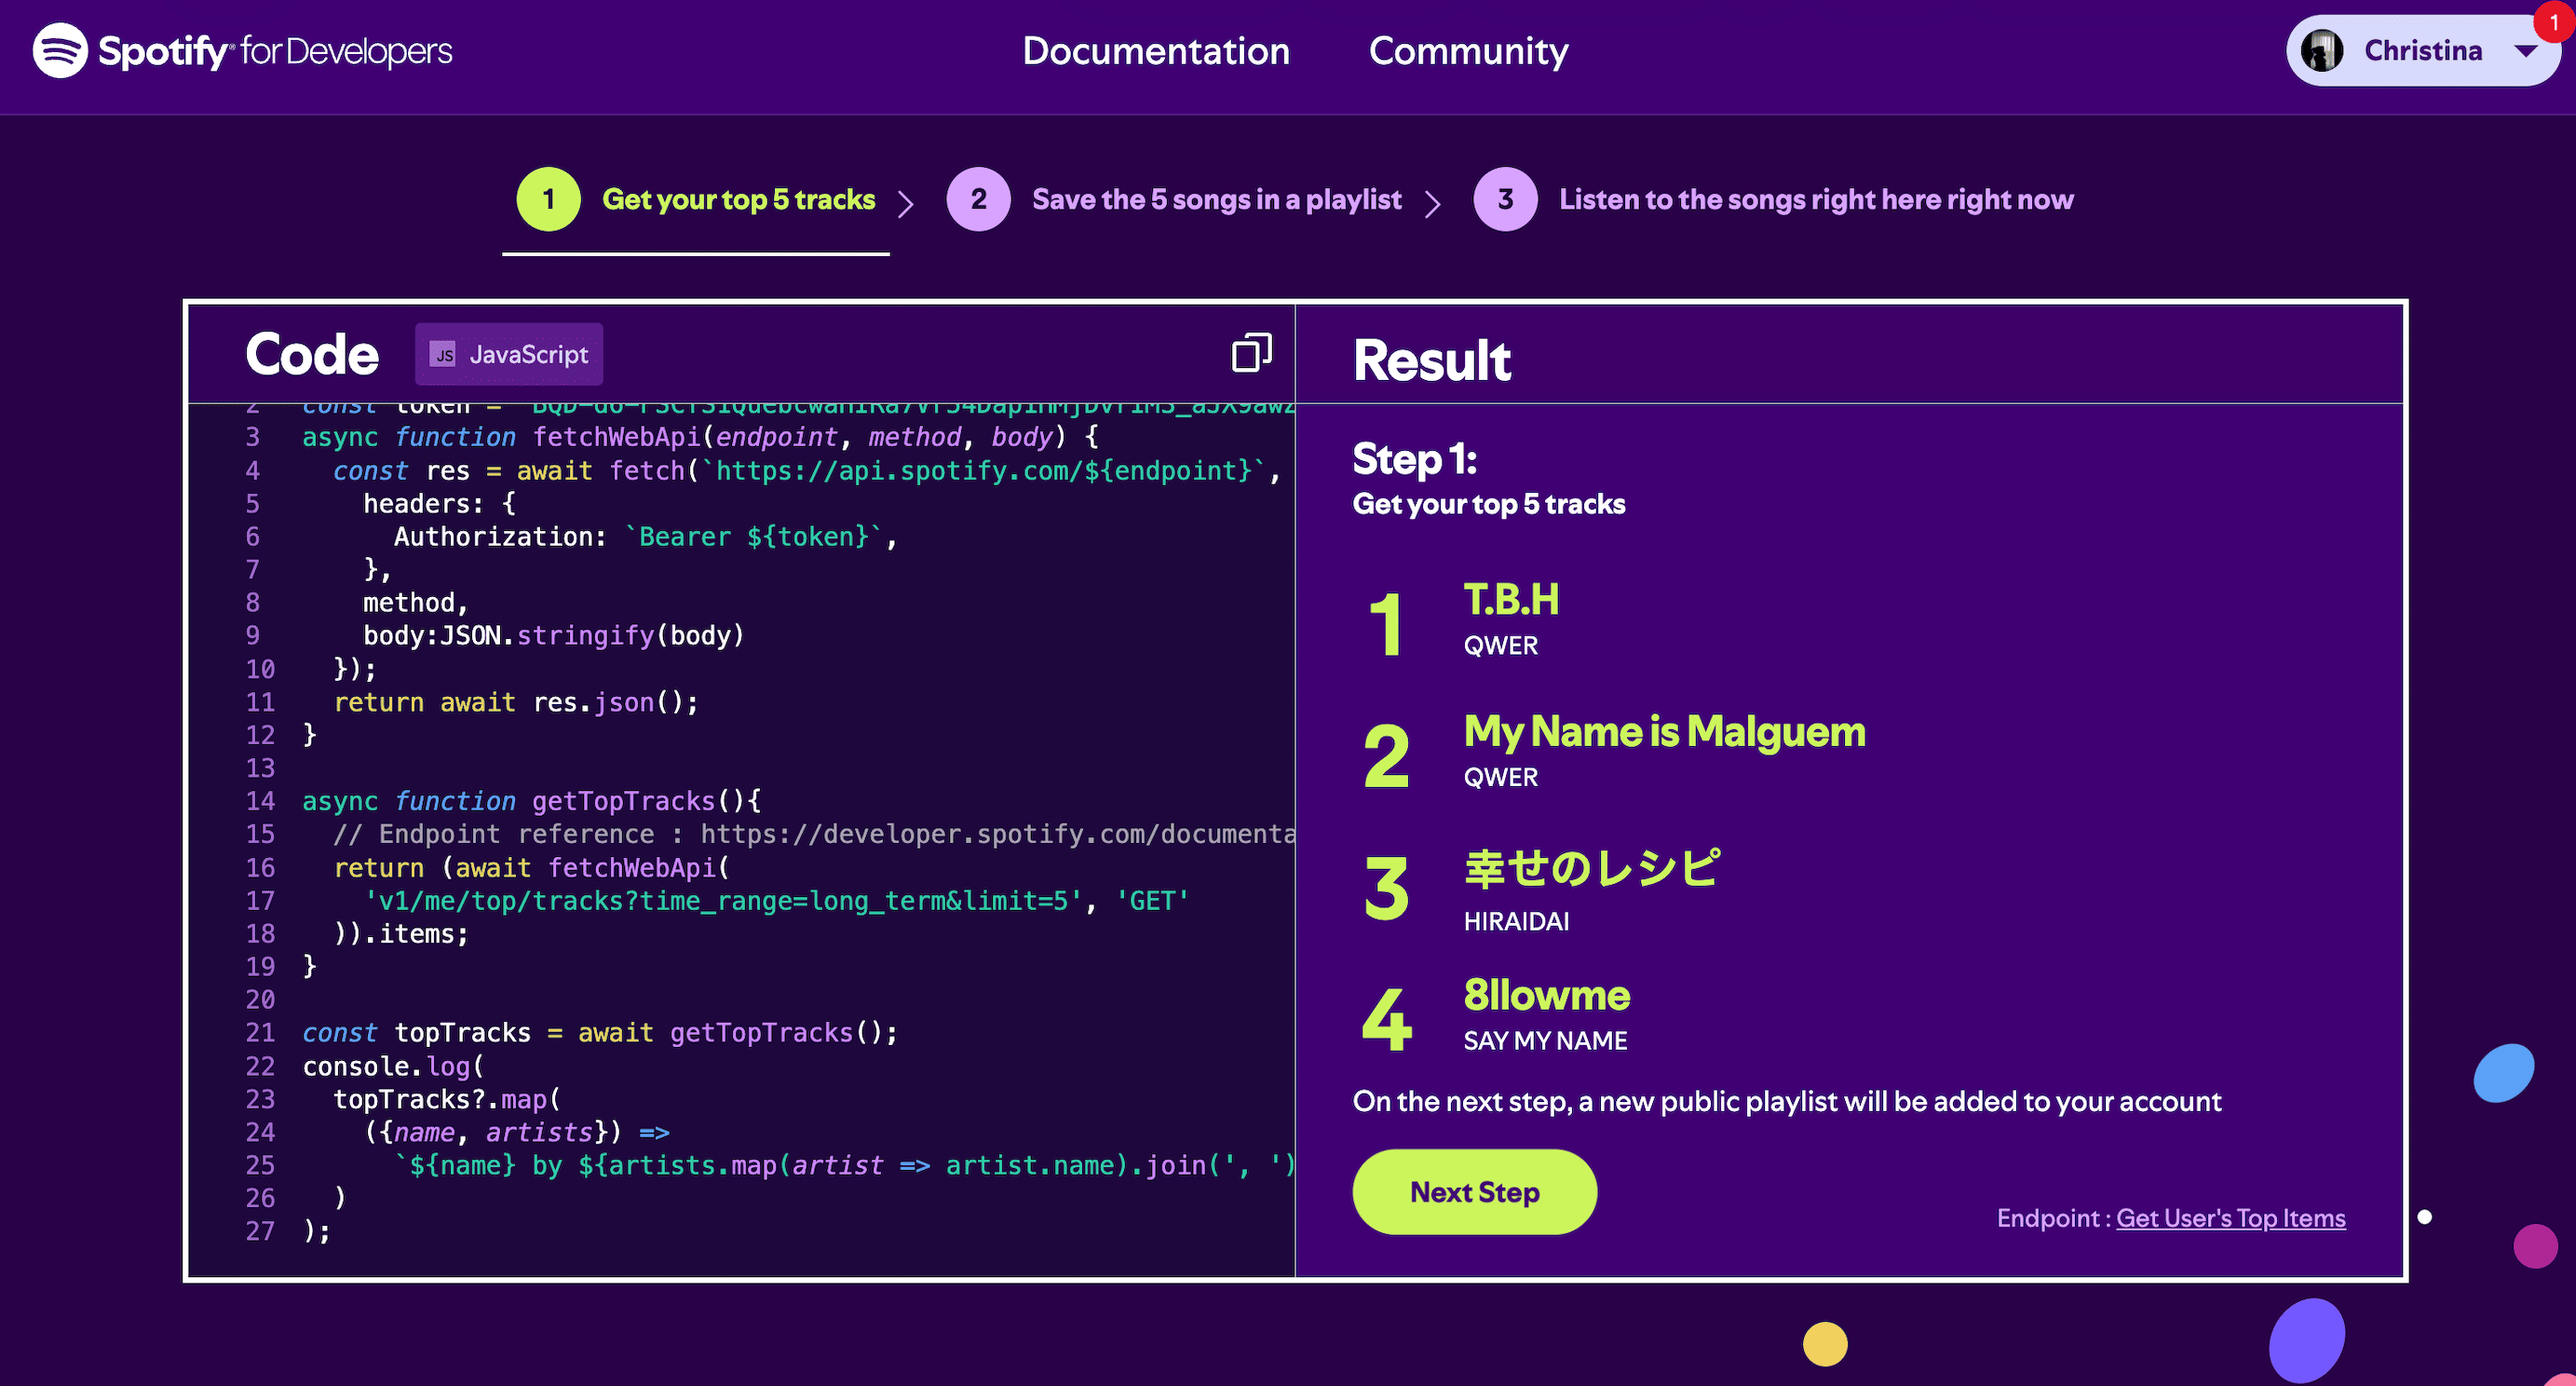
- Export: Get Spotify track rankings and artist info as CSV files.
- Merge: A small Python + Pandas script joins them using the primary artist’s ID. I made sure the merge keeps the original ranking order of the tracks, because a dashboard about “top songs” with shuffled ranks would be… not great 😅.
- Load: React reads the merged CSV when the page opens.
- Visualize: D3.js shapes and fine-tunes the charts so they fit the illustrations.
- Explore: Click artists, genres, or tracks to filter the view or start playing a song.
📊 What’s in the Dashboard?
| Feature | What it shows | Why it’s useful |
|---|---|---|
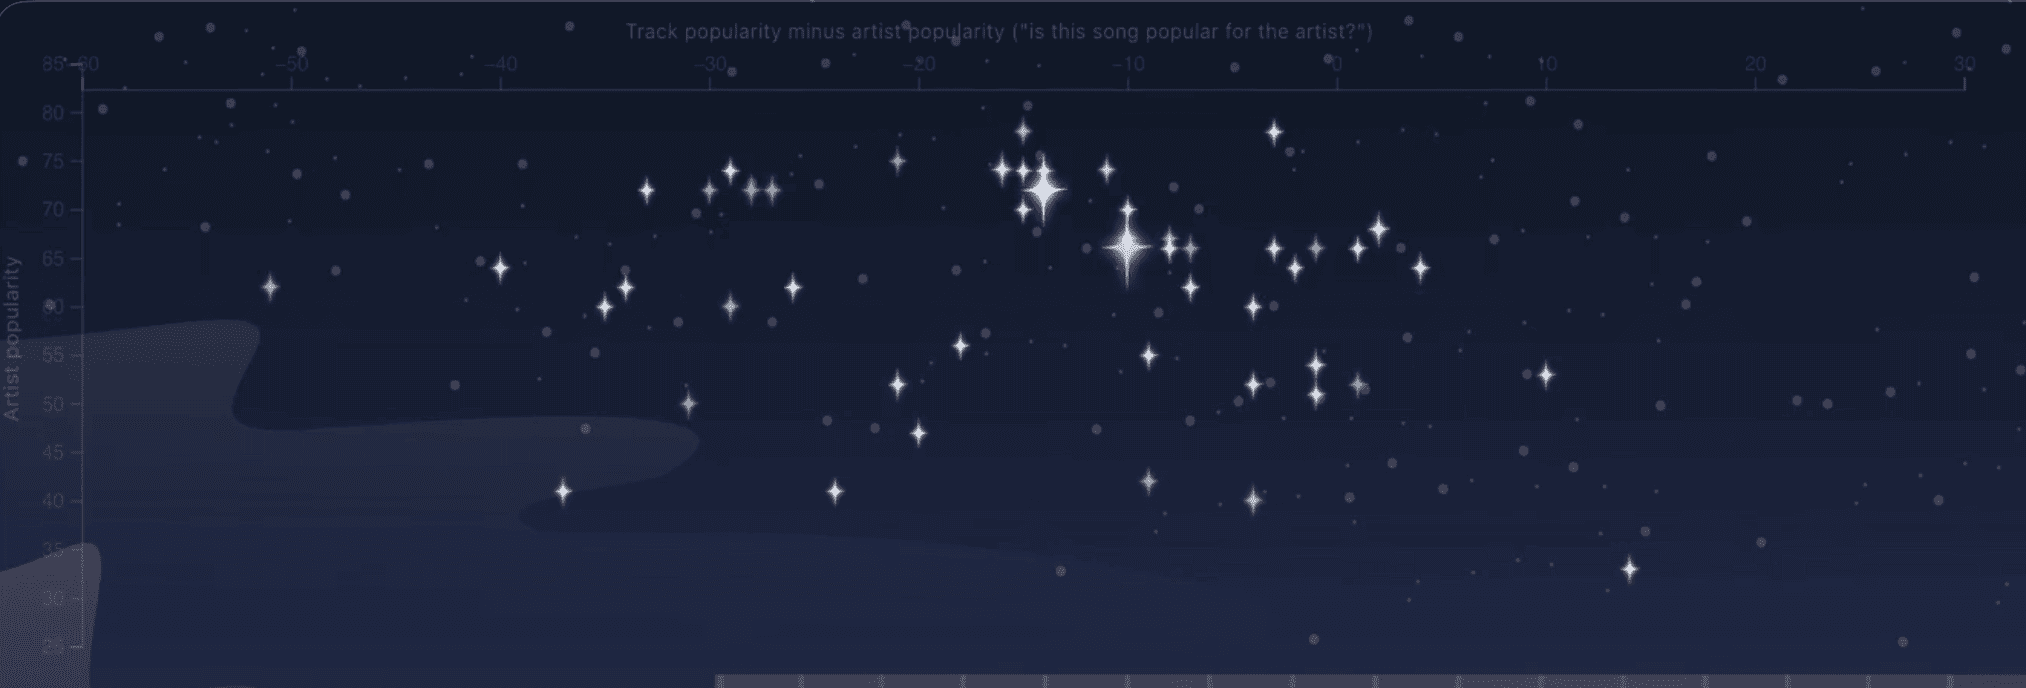
| Starry-sky scatter plot | Up to 50 tracks, plotted against track/artist popularity | Spot hits and hidden gems |
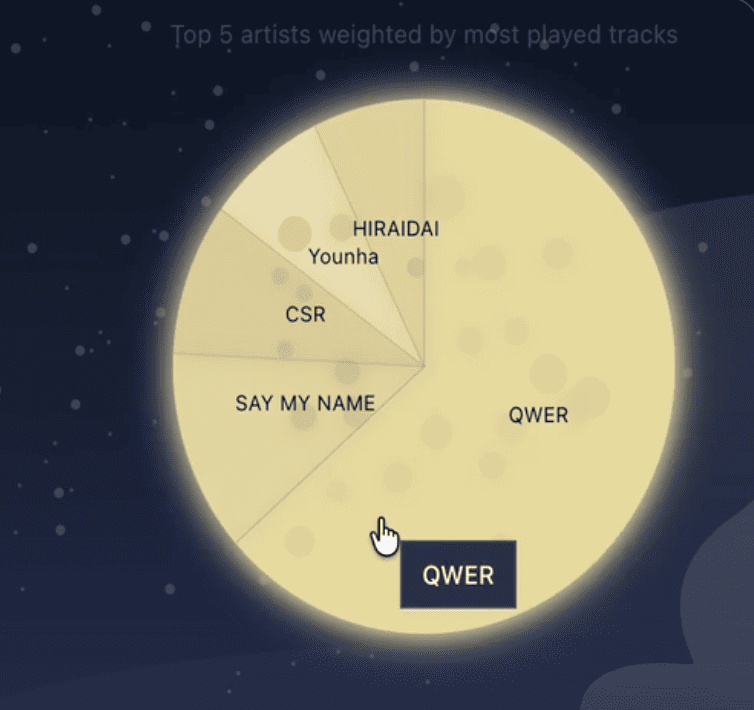
| Moon pie chart | Top 5 artists by rank-weighted score | See which artists stand out |
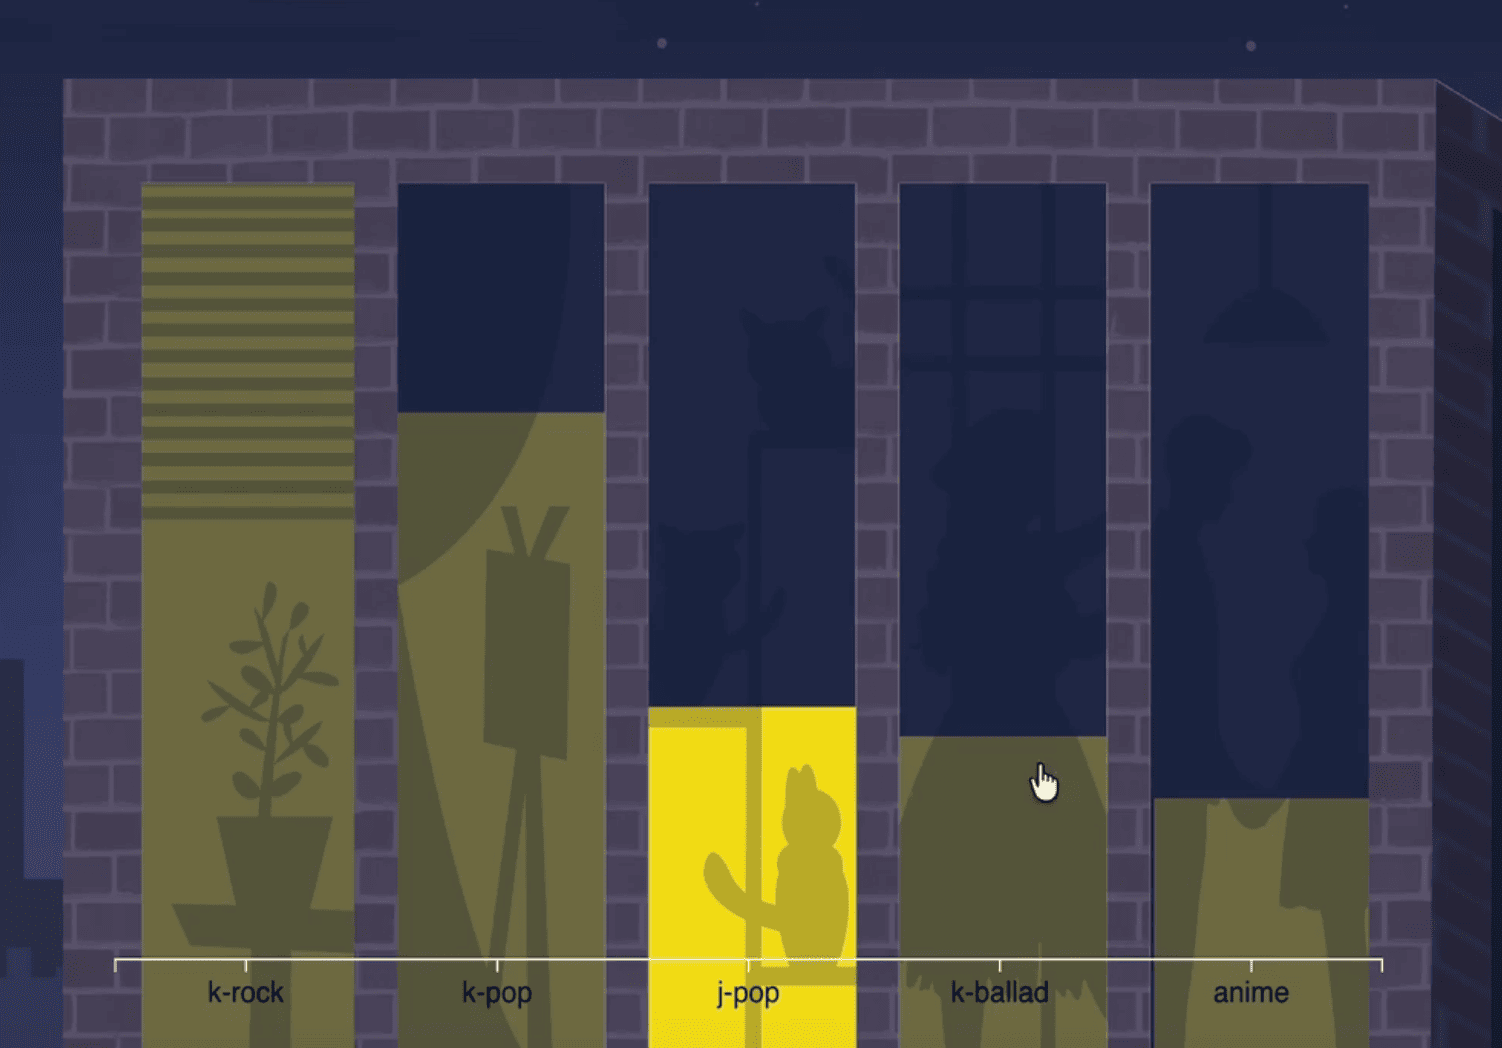
| Building bar chart | Top 5 primary genres by rank-weighted score | Understand your genre preferences |
| Interactive filters | Selected artist or genre | Narrow down the charts |
| Spotify player | Embedded track playback | Listen while exploring |
🎨 The Artsy Part
This is my favorite bit!
- Hand-drawn artwork: I drew all the illustrations myself in Affinity so the dashboard would have its own personality.
- Charts that blend in: I used D3.js to tweak positions, styles, and interactions until the data felt like part of the drawing, not something pasted on top.
| Art element | Chart | Creative idea |
|---|---|---|
| Moon (CSS) | Pie chart | A CSS-made moon turns the artist breakdown into a playful visual. |
| Starry sky | Scatter plot | Data points blend into the illustrated night sky like stars. |
| Building | Bar chart | The bars fit into the building illustration instead of looking like a standard chart. |
The whole idea: it should feel like exploring an illustration, not reading a spreadsheet ✨.
🔭 Okay, But How Do I Read It?
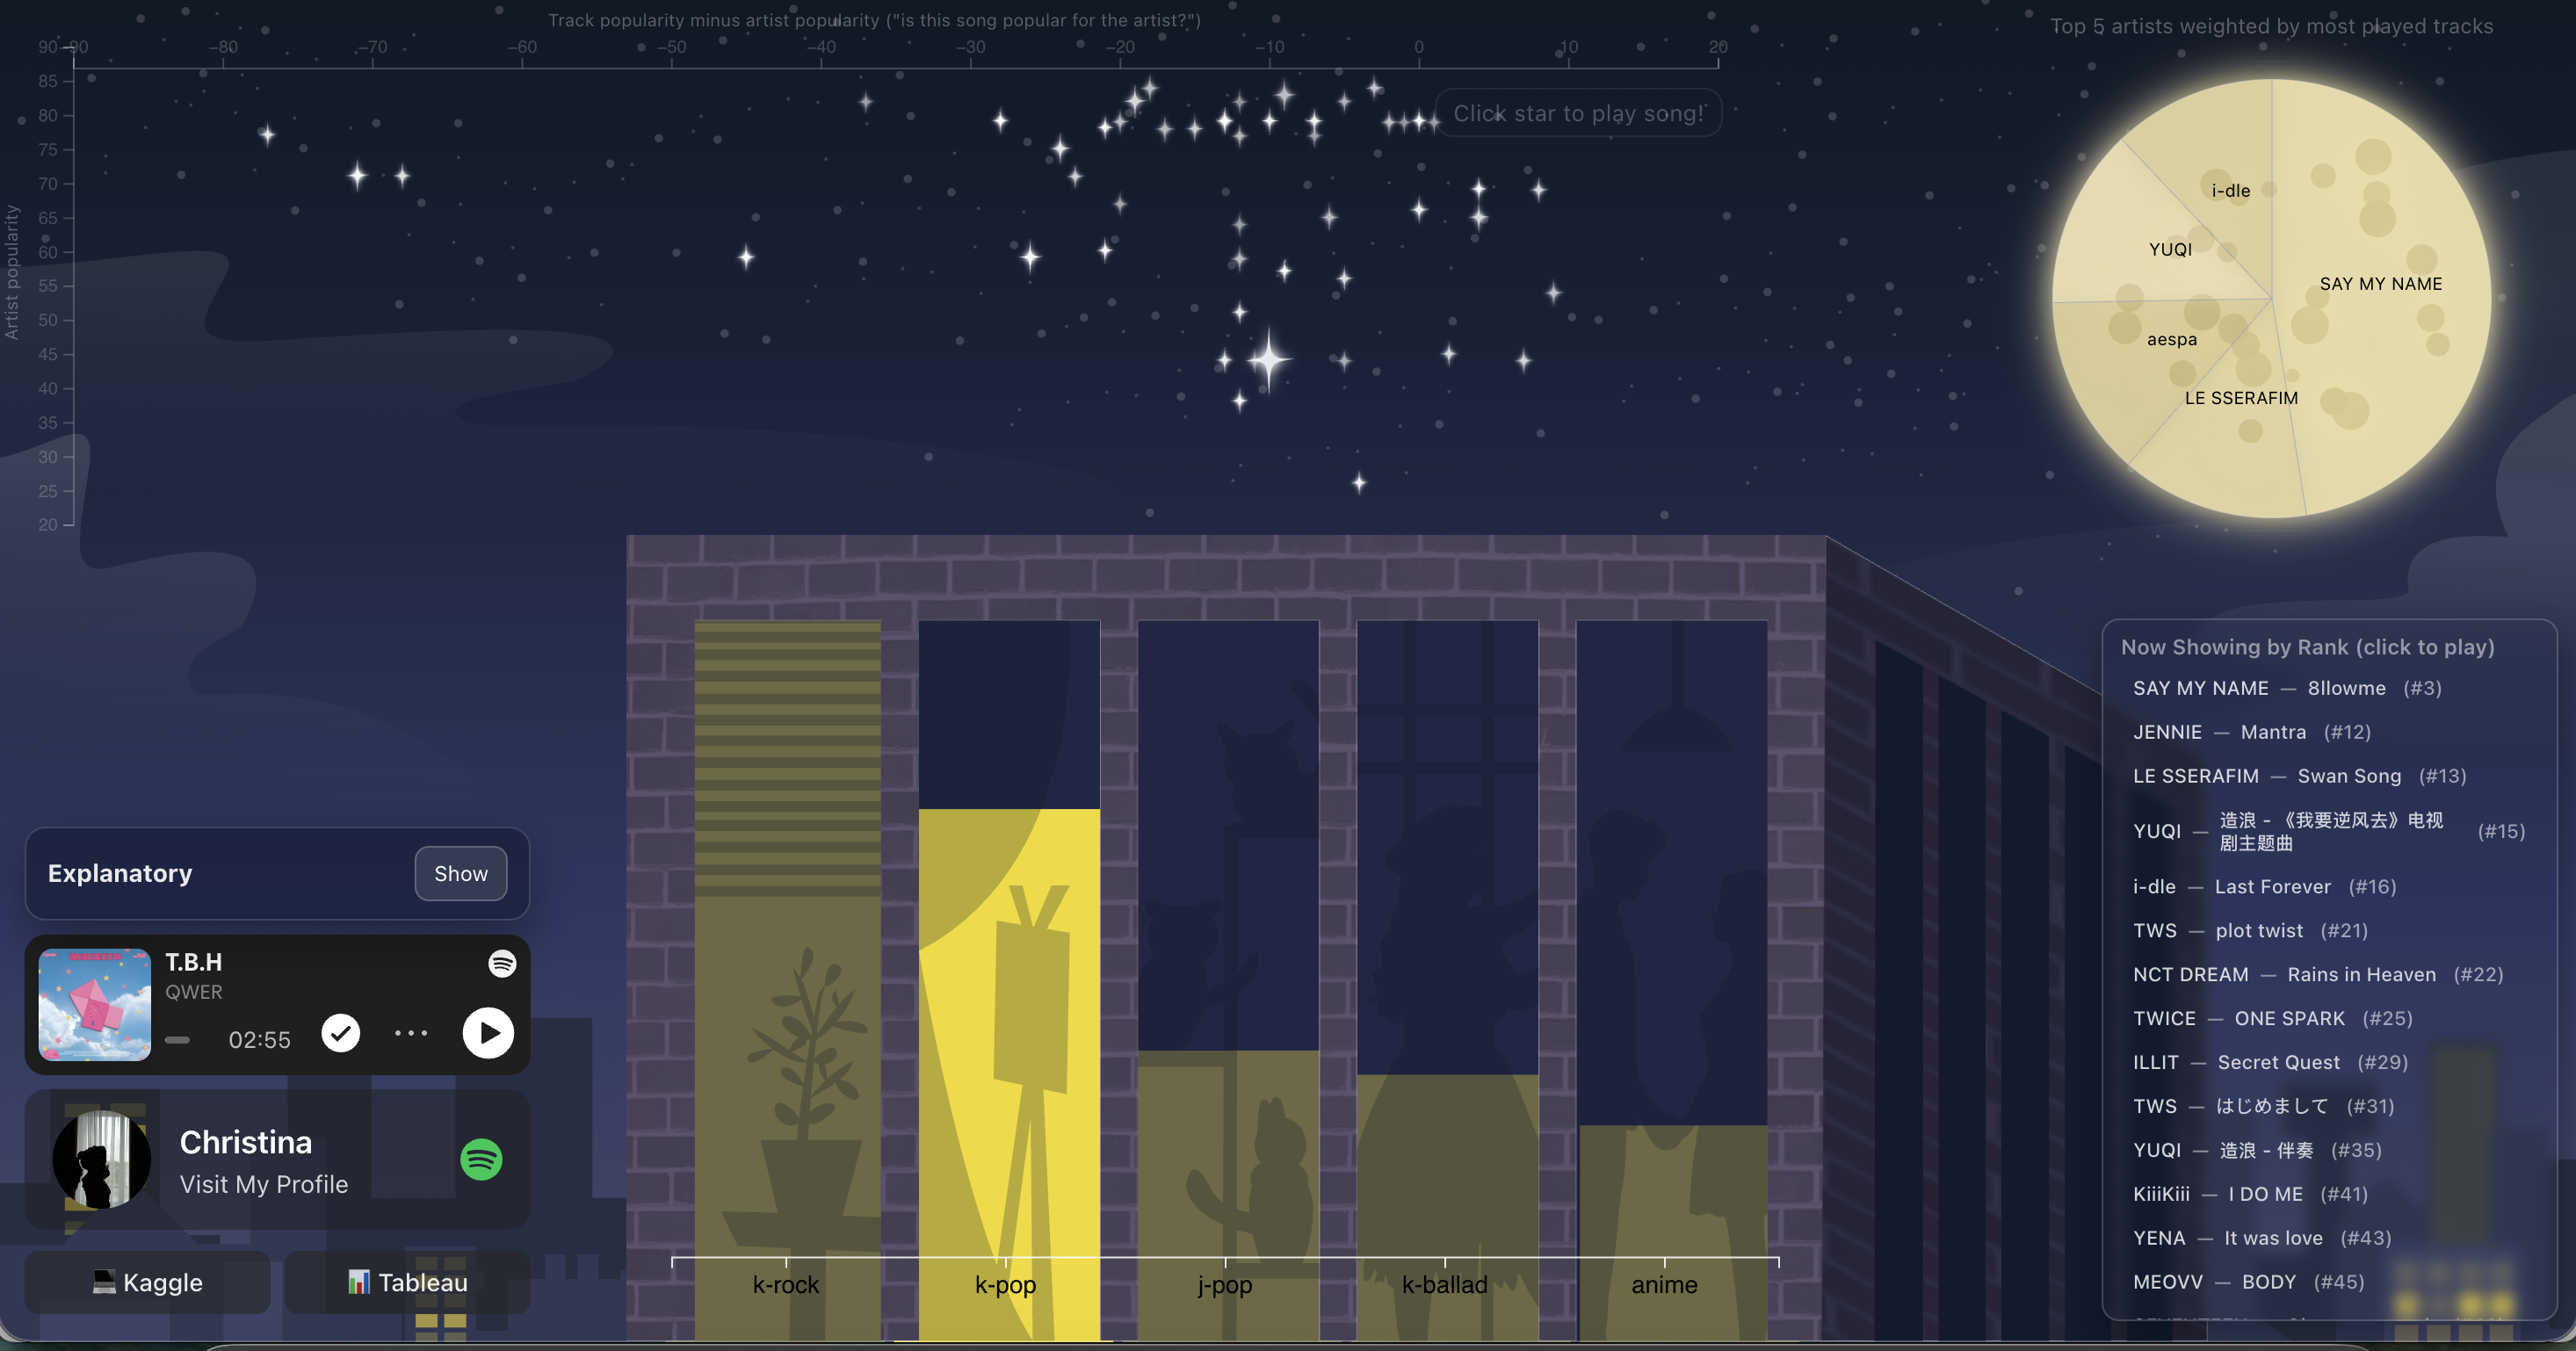
| Chart | How to read it | What it tells you |
|---|---|---|
| Starry sky / scatter plot | Higher = more popular artist. Right = track is more popular relative to its artist; left = less popular relative to its artist. | Find standout tracks, big artists, and underrated songs. |
| Moon / pie chart | A larger slice means the artist contributes more to the ranking score. | Which artists dominate your top-ranked songs. |
| Building / bar chart | A taller bar means the genre has a higher combined ranking score. | Which music styles appear strongest in your rankings. |
| Filters | Select an artist or genre to focus the charts on matching tracks. | Compare a specific artist or style with the wider collection. |
Quick example: The #1 track gets a score of 1 / 1 = 1.00, while track #10 gets 1 / 10 = 0.10. So higher-ranked songs carry more weight in the moon and building charts.
Small but important note: These are rank-weighted insights, not actual play counts or listening minutes. The genre chart uses each artist’s first listed genre, and everything reflects the CSV snapshot I used.
🤔 Decisions I Made (and What They Cost)
| Area | Decision | Trade-off |
|---|---|---|
| Frontend | React + TypeScript | Flexible, but adds component code |
| Charts | D3.js | Custom visuals, more setup |
| Art direction | My Affinity illustrations + CSS moon | Personal look, but more styling work |
| Data processing | Python + Pandas | Easy to merge, but refresh is manual |
| Storage | Static CSV | No database, but no live data |
| Playback | Spotify Embed | Simple integration, relies on Spotify |
| Hosting | Static deployment | Easy to run, but updating data needs a new build |
💸 Cost & Performance
- Static hosting: No always-on server or database eating money.
- Smaller files: Drop unused CSV columns to shrink the download.
- Chart limits: Show fewer points so things stay smooth.
- Browser caching: Cache static files so repeat visits load faster.
- Data refresh: Only rebuild when there’s a new Spotify export.
🔮 What’s Next?
Spoiler: I already started on the “live data” part 👀. There’s an Express + TypeScript backend in the repo with Spotify OAuth login and token refresh, plus a token interceptor on the frontend. It’s not powering the live site yet, but it’s the groundwork for pulling fresh data instead of CSV snapshots.
Other ideas on my list:
| Extension | Change | Benefit |
|---|---|---|
| Spotify API | Add authenticated data fetching | Fresher listening information |
| More filters | Filter by year or popularity | Deeper exploration |
| Listening trends | Compare ranking snapshots | See changes over time |
| Database | Save past datasets | Track long-term preferences |
| Mobile design | Improve responsive charts | Better phone experience |
📝 Design Journal, in a Nutshell
- Problem: Normal Spotify rankings are no fun to explore.
- Solution: Turn them into an artsy dashboard with interactive charts and music playback.
- Choice: My Affinity artwork + a CSS moon for the scenery, D3.js for chart tweaks, and Python for data prep.
- Trade-off: Lightweight and easy to host, but not real-time (yet!).
- Next step: Better data quality and live integration.
💬 Closing
This project taught me that data storytelling can be fun and pretty. Hand-drawn scenes, a bit of CSS, and D3.js turned a simple Spotify dataset into something I actually want to explore.
Put on your headphones and take a little night walk with me 🌙🎶